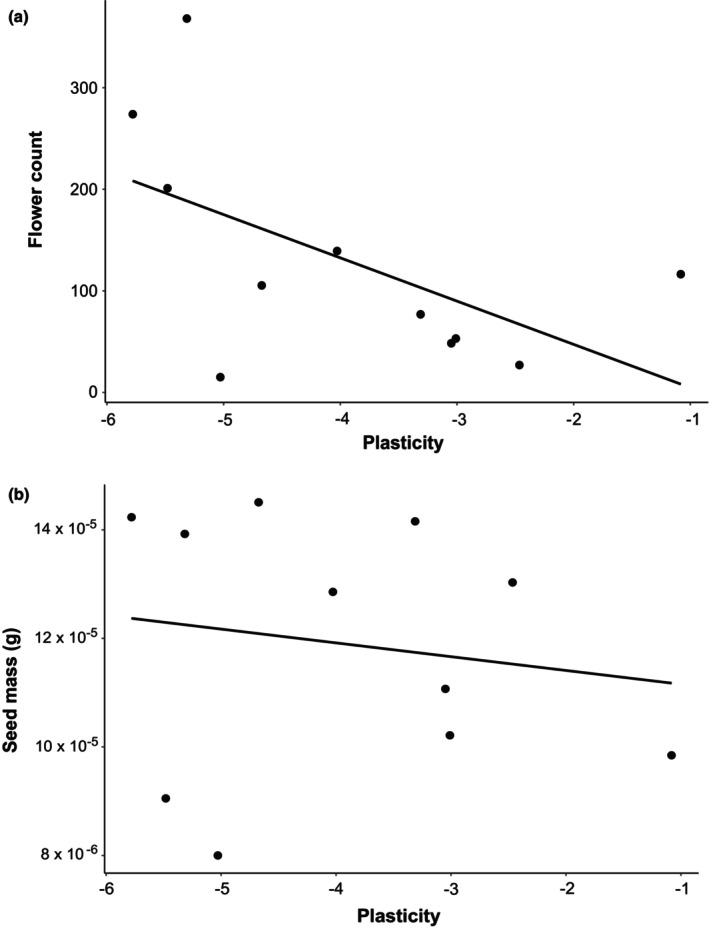
FIGURE 4.

Flower count (a) and seed mass (b) as a function of plasticity. Each point represents one H. perforatum population. Plasticity was measured as day of year of flowering as a response to temperature, meaning that more negative values indicate greater plasticity in phenology.
