FIGURE 6.

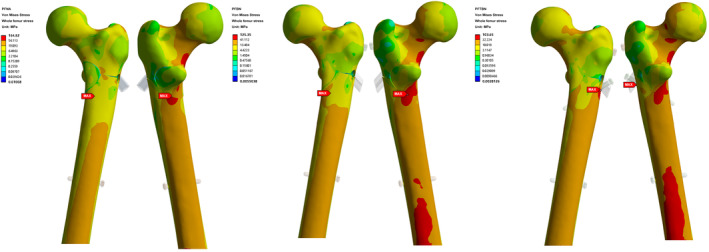
Nephogram of total von Mises Stress distribution of whole femur in PFNA group, PFBN group, and PFTBN group under three times body weight load.

Nephogram of total von Mises Stress distribution of whole femur in PFNA group, PFBN group, and PFTBN group under three times body weight load.