
FIGURE 6.
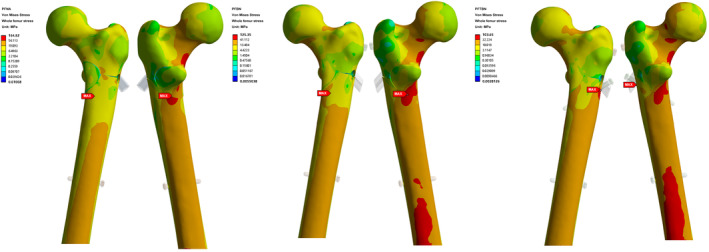
Nephogram of total von Mises Stress distribution of whole femur in PFNA group, PFBN group, and PFTBN group under three times body weight load.
Official websites use .gov
A
.gov website belongs to an official
government organization in the United States.
Secure .gov websites use HTTPS
A lock (
) or https:// means you've safely
connected to the .gov website. Share sensitive
information only on official, secure websites.
Nephogram of total von Mises Stress distribution of whole femur in PFNA group, PFBN group, and PFTBN group under three times body weight load.