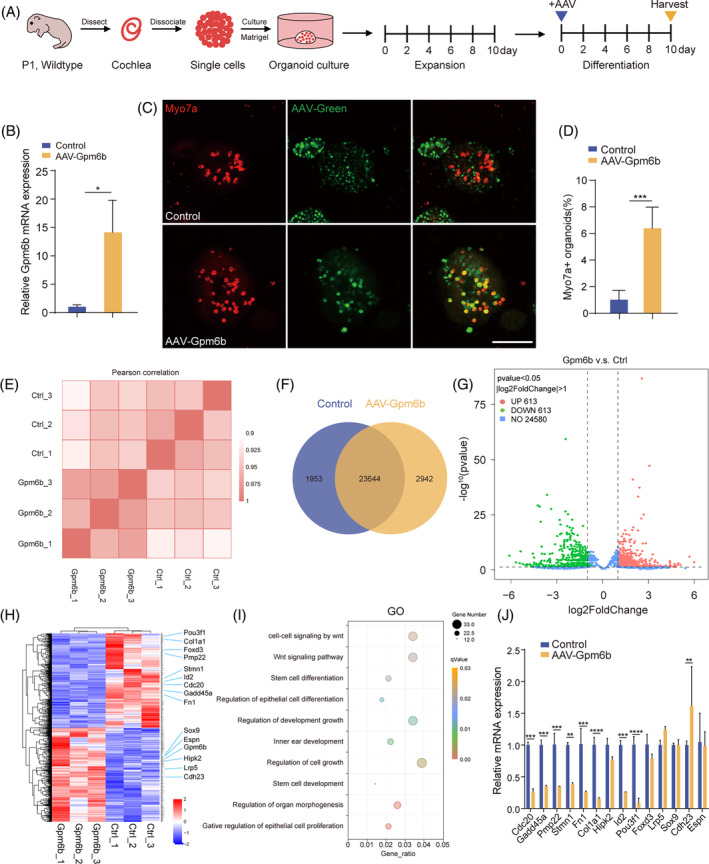
FIGURE 2.

Gpm6b overexpression promoted HC regeneration in cochlear organoids. (A) Experimental design of the differentiation culture of cochlear organoids in the three‐dimensional in vitro assay. AAV dose: 2 × 10¹⁰ GCs per well. (B) Relative mRNA expression of Gpm6b in the cochlear organoids. (C) Immunofluorescence images of the organoids in (A). Scale bar: 100 μm. (D) The Myo7a+ organoids ratio was calculated in (C). (E–I) RNA sequencing data from cochlear organoids was added with control and AAV‐Gpm6b, respectively. (E) Correlation analysis between control and AAV‐Gpm6b–transduced organoids. (F) Venn diagram analysis of differentially expressed genes. (G) The volcano plot shows the overall profile of differentially expressed genes. Red/green dots indicate up/down‐regulated genes, respectively. Genes with no statistically significant expression difference are shown as blue dots. |log2FoldChange| > 1 and p‐value < 0.05 were the cutoffs for differentially expressed genes. (H) Heatmap of the differentially expressed genes. (I) GO terms significantly enriched in differentially expressed genes in Gpm6b‐overexpressing organoids. (J) The differentially expressed genes identified in (H) were verified by qPCR. Data are displayed as the mean with SEM. The value of p was calculated by Student's t‐test. **p < 0.01; ***p < 0.001; n.s. refers to no significance.
