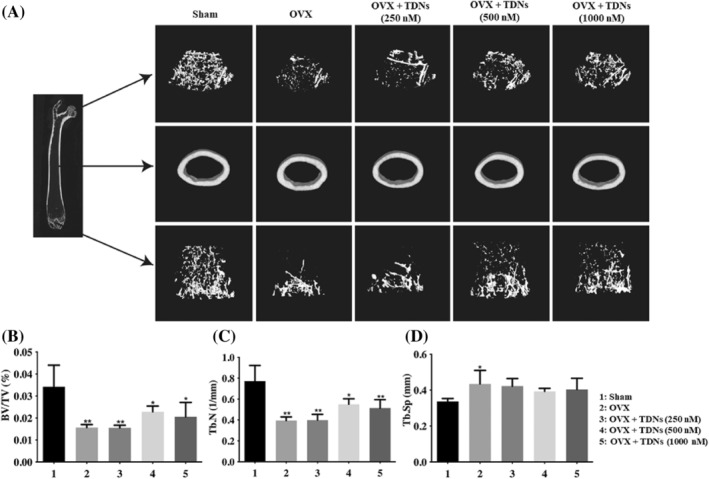
FIGURE 2.

Microcomputed tomography (Micro‐CT) images of the femurs. (A) Micro CT images of the femurs. (B–D) Analysis of bone volume fraction (BV/TV), bone trabecular number (Tb. N), bone separation (Tb. SP) of femurs after treatment with different materials at 2 months, respectively (*p < 0.05, **p < 0.01 vs. Sham).
