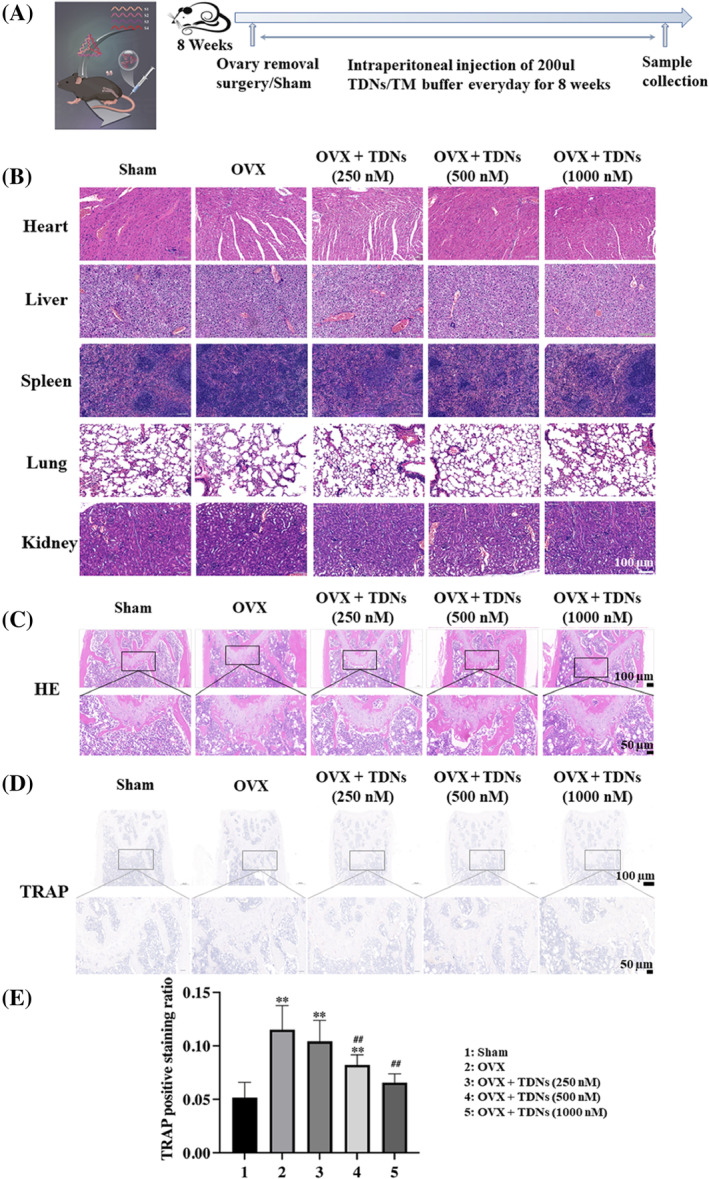
FIGURE 3.

Animal moulding process and staining. (A) Time chart of animal moulding and treatment. (B) Haematoxylin–eosin (HE) staining of heart, liver, spleen, lung, and kidney of each group after 8 weeks of treatment separately (Scale bar: 100 μm). (C) HE staining of the femurs of each group after 8 weeks of treatment (Scale bar: 100 and 50 μm). (D) Tartrate‐resistant acid phosphatase (TRAP) staining of the femurs of each group after 8 weeks of treatment (Scale bar: 100 and 50 μm). (E) Statistical analysis of TRAP staining (*p < 0.05, **p < 0.01 vs. sham; # p < 0.05, ## p < 0.01 vs. ovariectomy [OVX]). TDN, tetrahedral DNA nanostructure.
