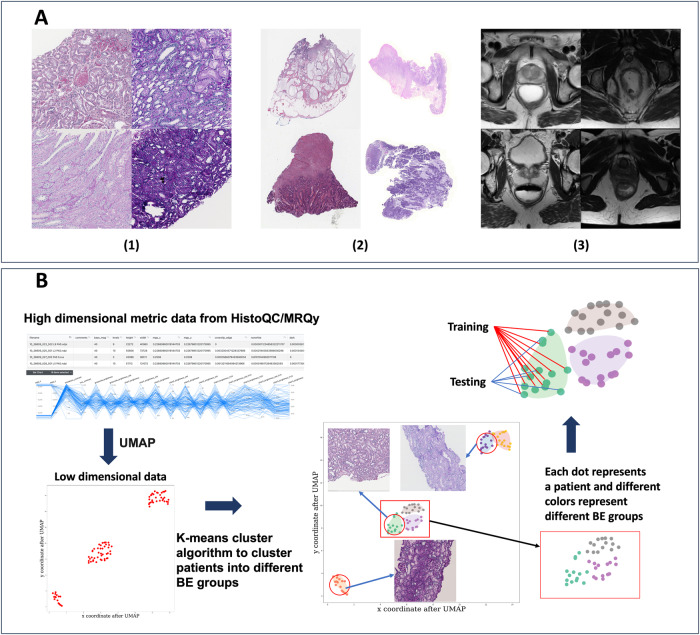
Fig. 1. Batch effect examples and workflow for CohortFinder in digital pathology and radiology domains.
A Examples of the batch effects with (1) four ROIs from the tubule segmentation task, (2) four WSI thumbnails from the colon adenocarcinoma detection task, and (3) four images sections from four different patients from the rectal cancer segmentation task. As can be seen, the DP images show notable differences in white balance, brightness, and contrast demonstrating clear BEs. Similarly, the MRI imaging data also shows significant differences in foreground contrast. B The basic workflow for CohortFinder. First, UMAP is used to project high-dimensional quality control metric values into a two-dimensional space. Second, k-means clustering takes place in this two-dimensional space to identify BE-groups using approximately k target clusters. Finally, patients in each BE group are assigned to a training/testing set based on the user-given ratio while sampling from each BE group.

