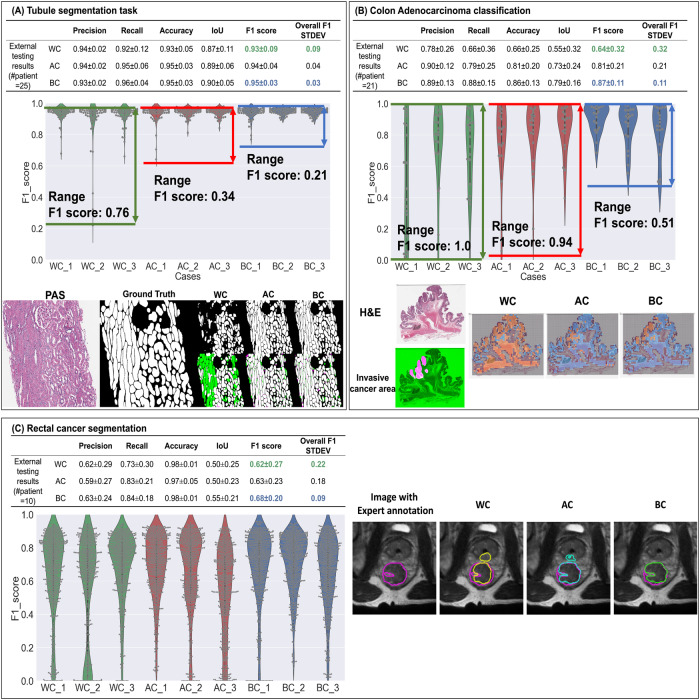
Fig. 2. Quantitative and qualitative results for all three use cases.
For each use case, we have (1) The overall performance on external testing datasets. (2) F1 score performance for 9 different models on the external testing datasets, where the gray dots in each violin plot indicate individual performance for a single image. (3) Qualitative results. In tubule segmentation task (A), the first column is a cropped PAS-stained image, the second column is the tubule segmentation ground truth (GT), and the remaining images are the results of WC, AC, and BC. In each scenario, the top row is the DL model result, while the bottom row corresponds to the overlay image between DL output images and the GT, where green parts represent the false negative (FN) area, and the fuchsia parts represent the false positive (FP) area. WC has more FN and FP areas compared to AC & BC. Compared to AC, BC has fewer FN and FP areas. For colon cancer classification task (B), the images in the first column are the H&E thumbnails and cancer annotation (the tumor area in fuchsia, non-tumor in green). The remaining three images are the heatmaps for the WC/AC/BC, where the orange area represents the predicted cancer area, blue represents the predicted no-cancer area, and the gray area represents the non-informative area (background/non-tissue area). From the heatmaps, WC over-predicts the tumor regions, AC under-predicts the tumor region, while BC yields the best overlap between tumor area and ground truth. For rectal cancer segmentation task (C), the first column is the image with expert annotation ground truth in fuchsia, which is also shown as a fuchsia contour in the remaining three columns. The 2D U-net segmentation results for WC (yellow), AC (cyan), and BC (green) show that WC and AC overpredict the tumor region while BC marginally underpredicts. In all three tasks, violin plots of F1 scores show a decreasing trend from BC to AC to WC. AC is also seen to have a larger F1 score range, lower average F1 value, and a higher standard deviation than BC; suggesting AC performance is less robust than BC.

