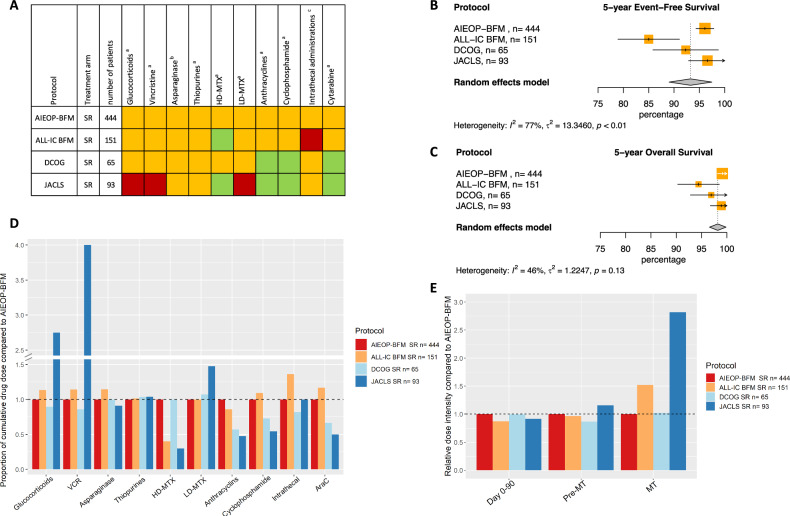
Fig. 4. Outcome of trial group B LR.
A Visual summary of cumulative dose analysis. Colored squares represent cumulative dose relative to the largest trial. Green represents lower cumulative dose, yellow similar, and red higher cumulative dose. B Meta-analysis of 5-year event-free survival (%), C Meta-analysis of 5-year overall survival (%), D Overview of cumulative drug doses proportionate to the largest clinical trial, E Relative dose intensity during day 0-90, day 0 till start maintenance and maintenance therapy. VCR vincristine, HD-MTX high-dose methotrexate, LD-MTX low-dose methotrexate, AraC cytarabine, SR standard risk, MT maintenance therapy.

