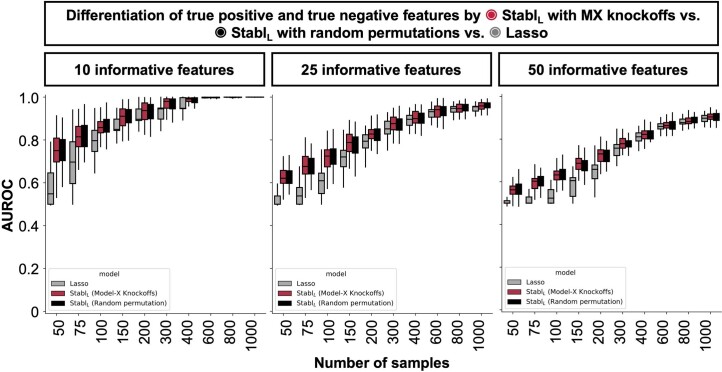
Extended Data Fig. 5. Reliability performance of selection frequency (StablL) and beta coefficients (Lasso) to distinguish true positive and true negative features.
Beta coefficients assigned by Lasso and feature selection frequency assigned by Stabl were used to distinguish true positive and true negative features in a synthetic dataset with p = 1000 total features. The AUROC for this procedure is shown as a function of the number of samples (n, x-axis) for 10 (left panels), 25 (middle panels), or 50 (right panels) informative features. Boxes in box plots indicate the median and interquartile range (IQR), with whiskers indicating 1.5 × IQR.

