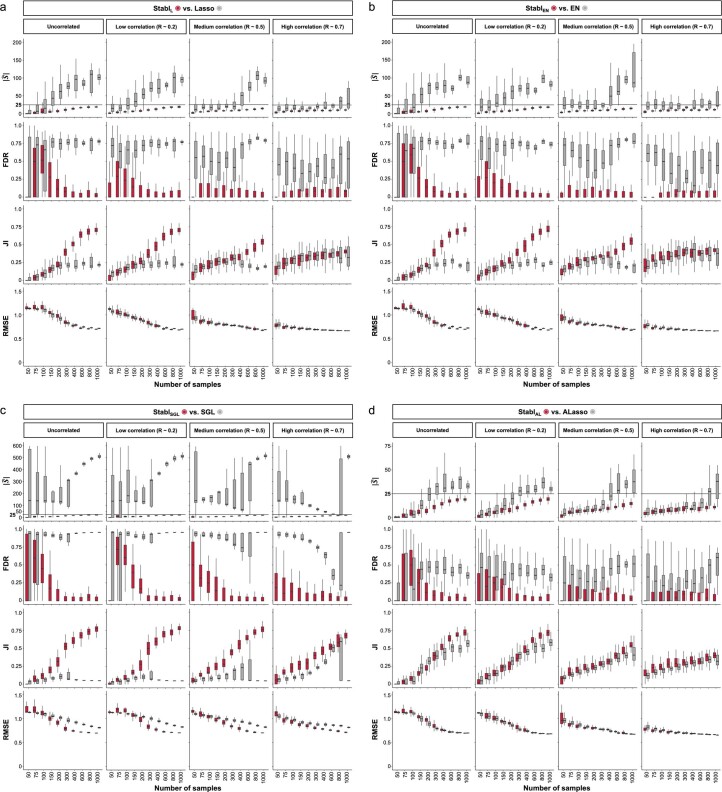
Extended Data Fig. 7. Stabl’s performance on synthetic data with different correlation structures.
Synthetic datasets differing in correlation structure (low, medium, or high) were generated as described in Fig. 3. Sparsity (∣Ŝ∣, upper panels), reliability (FDR and JI, middle panels), and predictivity performances (AUROC, lower panels) for StablL (a), StablEN (b), StablSGL (c), and StablAL (d) (red box plots) and Lasso (grey box plots) as a function of the number of samples (n, x-axis) for 10 (left panels), 25 (middle panels), or 50 (right panels) informative features. Boxes in box plots indicate the median and interquartile range (IQR), with whiskers indicating 1.5 × IQR.

