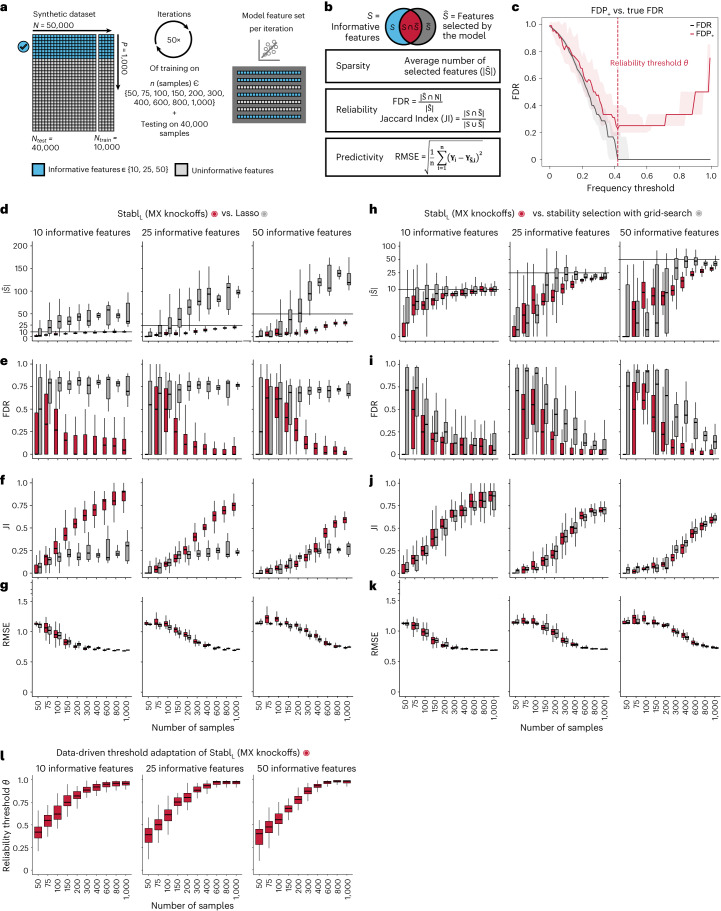
Fig. 2. Synthetic dataset benchmarking against Lasso.
a, A synthetic dataset consisting of n = 50,000 samples × p = 1,000 normally distributed features was generated. Some features are correlated with the outcome (informative features, light blue), whereas the others are not (uninformative features, gray). Forty thousand samples are held out for validation. Out of the remaining 10,000, 50 sets of sample sizes n ranging from 50 to 1,000 are drawn randomly to assess model performance. The StablSRM framework is used using Lasso (StablL) with MX knockoffs for noise generation. Performances are tested on continuous outcomes (regression tasks). b, Sparsity (average number of selected features, ), reliability (true FDR and JI) and predictivity (RMSE) metrics used for performance evaluation. c, The FDP+ (red line; 95% CI, red shading) and the true FDR (gray line; 95% CI, gray shading) as a function of the frequency threshold (example shown for n = 150 samples and 25 informative features; see Extended Data Fig. 3 for other conditions). The FDP+ estimate approaches the true FDR around the reliability threshold, θ. d–g, Sparsity (d), reliability (FDR, e; JI, f) and predictivity (RMSE, g) performances of StablL (red box plots) and Lasso (gray box plots) with increasing number of samples (n, x axis) for 10 (left panels), 25 (middle panels) or 50 (right panels) informative features. h–k, Sparsity (h), reliability (i and j) and predictivity (k) performances of models built using a data-driven reliability threshold θ (StablL, red box plots) or grid search-coupled SS (gray box plots). l, The reliability threshold chosen by StablL shown as a function of the sample size (n, x axis) for 10 (left panel), 25 (middle panel) or 50 (right panel) informative features. Boxes indicate median and IQR; whiskers indicate 1.5× IQR.

