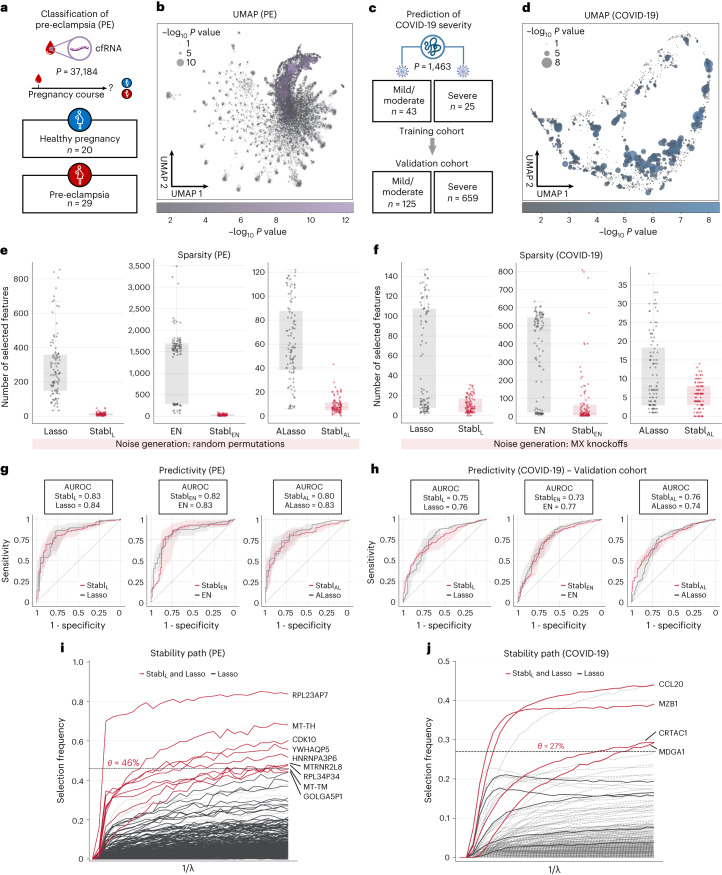
Fig. 4. Stabl’s performance on transcriptomic and proteomic data.
a, Clinical case study 1: classification of individuals with normotensive pregnancy or PE from the analysis of circulating cfRNA sequencing data. The number of samples (n) and features (p) are indicated. b, UMAP visualization of the cfRNA transcriptomic features; node size and color are proportional to the strength of the association with the outcome. c, Clinical case study 2: classification of mild versus severe COVID-19 in two independent patient cohorts from the analysis of plasma proteomic data (Olink). d, UMAP visualization of the proteomic data. Node characteristics as in b. e,f, Sparsity performances (the number of features selected across n = 100 CV iterations, median and IQR) on the PE (e) and COVID-19 (f) datasets for StablL (left), StablEN (middle) and StablAL (right). g,h, Predictivity performances (AUROC, median and IQR) on the PE (g) and COVID-19 (h, validation set; training set shown in Supplementary Table 5) datasets for StablL (left), StablEN (middle) and StablAL (right). StablSRM performances are shown using random permutations for the PE dataset and MX knockoffs for the COVID-19 dataset. Median and IQR values comparing StablSGL performances to the cognate SRM are listed numerically in Supplementary Table 5. Results in the COVID-19 dataset using random permutations are also shown for StablL in Supplementary Table 5. i,j, StablL stability path graphs depicting the relationship between the regularization parameter and the selection frequency for the PE (i) and COVID-19 (j) datasets. The reliability threshold (θ) is indicated (dotted line). Features selected by StablL (red lines) or Lasso (black lines) are shown. Significance between outcome groups was calculated using a two-sided Mann–Whitney test. Box plots indicate median and IQR; whiskers indicate 1.5× IQR.

