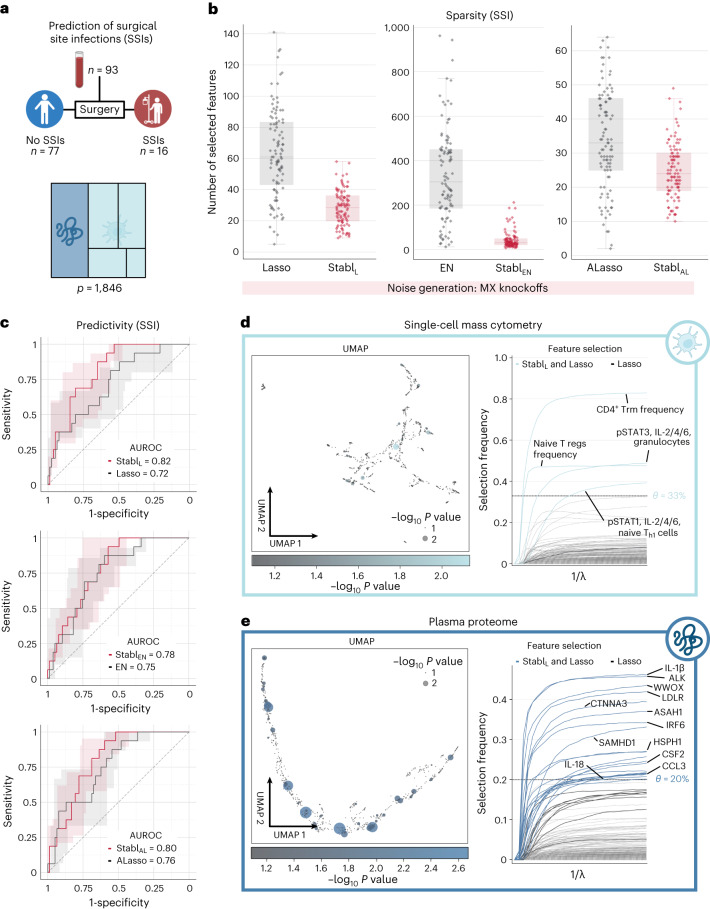
Fig. 6. Candidate biomarker identification using Stabl for analysis of a newly generated multi-omic clinical dataset.
a, Clinical case study 5: prediction of post-operative SSIs from combined plasma proteomic and single-cell mass cytometry assessment of pre-operative blood samples in patients undergoing abdominal surgery. b, Sparsity performances (the number of features selected across n = 100 CV iterations) for StablL (left), StablEN (middle) and StablAL (right) compared to their respective SRMs (late-fusion data integration method). c, Predictivity performances (AUROC) for StablL (upper), StablEN (middle) and StablAL (lower). StablSRM performances are shown using MX knockoffs. Results using random permutations are shown in Supplementary Table 5. Median and IQR values comparing StablSRM performances to their cognate SRMs are listed in Supplementary Table 5. d,e. UMAP visualization (left) and stability path (right) of the mass cytometry (d) and plasma proteomic (e) datasets. UMAP node size and color are proportional to the strength of association with the outcome. Stability path graphs denote features selected by StablL. The data-driven reliability threshold θ is computed for individual omic datasets and indicated by a dotted line. Significance of the association with the outcome was calculated using a two-sided Mann–Whitney test. Box plots indicate median and IQR; whiskers indicate 1.5× IQR.

