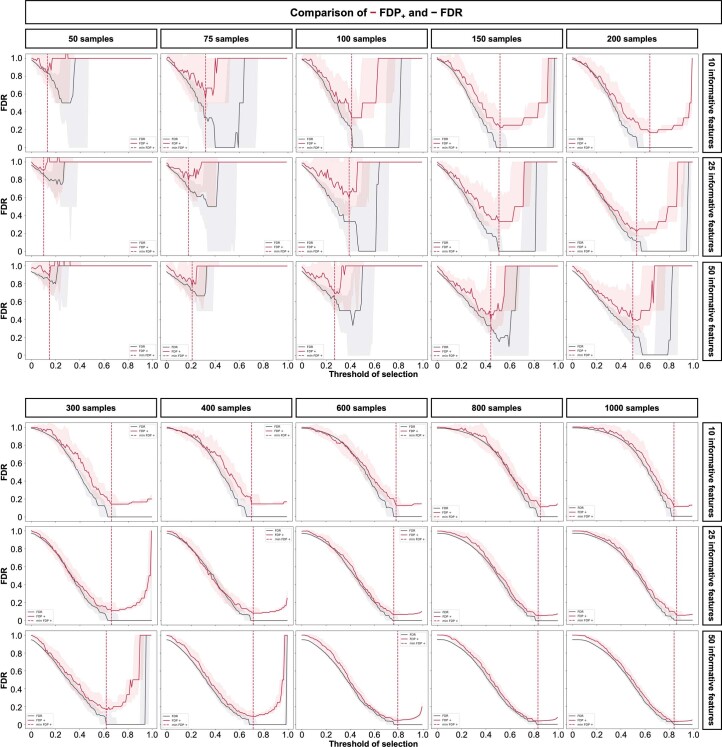
Extended Data Fig. 2. Comparison of FDP+ and FDR in synthetic dataset benchmarking.
On the generated synthetic dataset, the FDP+ and the true FDR were assessed for different dataset sizes ranging from n = 50 to 1000 samples with 10 (upper panels), 25 (middle panels), or 50 (lower panels) informative features. The FDP+ (red line) and the true FDR (black line) are shown as a function of the frequency threshold. The selected reliability threshold (θ, red dotted line) varied across conditions. Boxes in box plots indicate the median and interquartile range (IQR), with whiskers indicating 1.5 × IQR.

