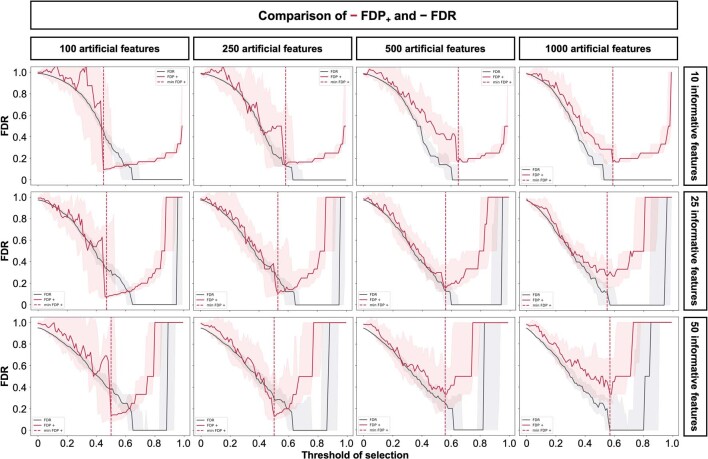
Extended Data Fig. 3. Effect of varying numbers of artificial features on the computation of FDP+.
On the generated synthetic dataset, the FDP+ and the true FDR were assessed for a varying number of artificial features on a dataset of n = 200 samples and 10 (upper panels), 25 (middle panels), or 50 (lower panels) informative features within p = 1000 features. The FDP+ (red line) and the true FDR (black line) are shown as a function of the frequency threshold. Increasing the number of artificial features allows for a more accurate estimation of the reliability threshold (θ, red dotted line). Boxes in box plots indicate the median and interquartile range (IQR), with whiskers indicating 1.5 × IQR.

