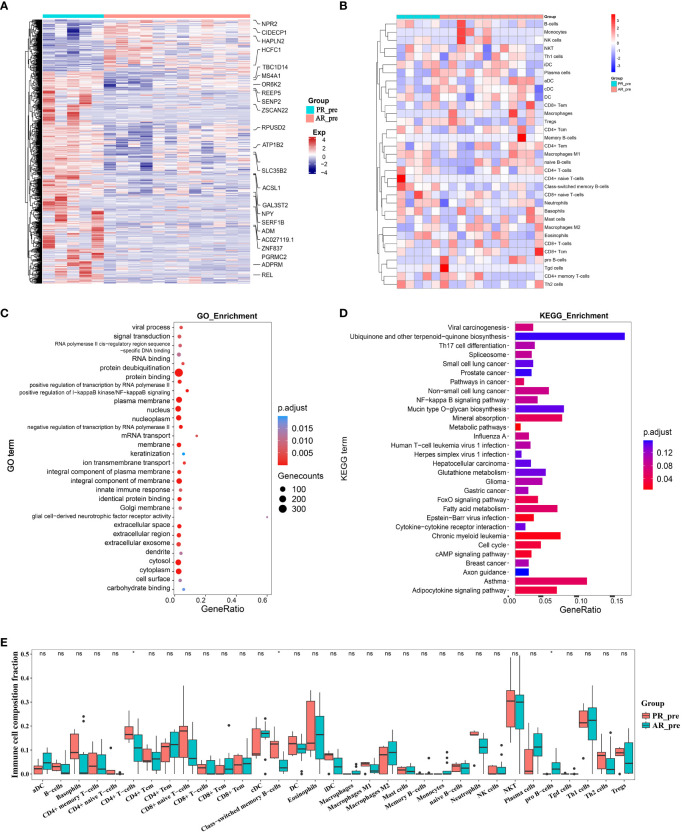
Figure 2.
Changes in expression between primary and acquired resistance patients before cisplatin and etoposide treatment. (A) Heatmap analysis of DEGs between PR_pre and AR_pre groups. (B) Heatmap comparing expression levels of 64 cell components from xCell between PR_pre and AR_pre groups. (C) GO functional enrichment analysis, showing 30 most enriched GO terms. (D) KEGG enrichment analysis, showing 30 most enriched KEGG pathways. (E) Boxplot showing xCell enrichment scores of 33 immune cells between PR_pre and AR_pre groups, where * indicates p-value < 0.05 and ns indicates not significant.

