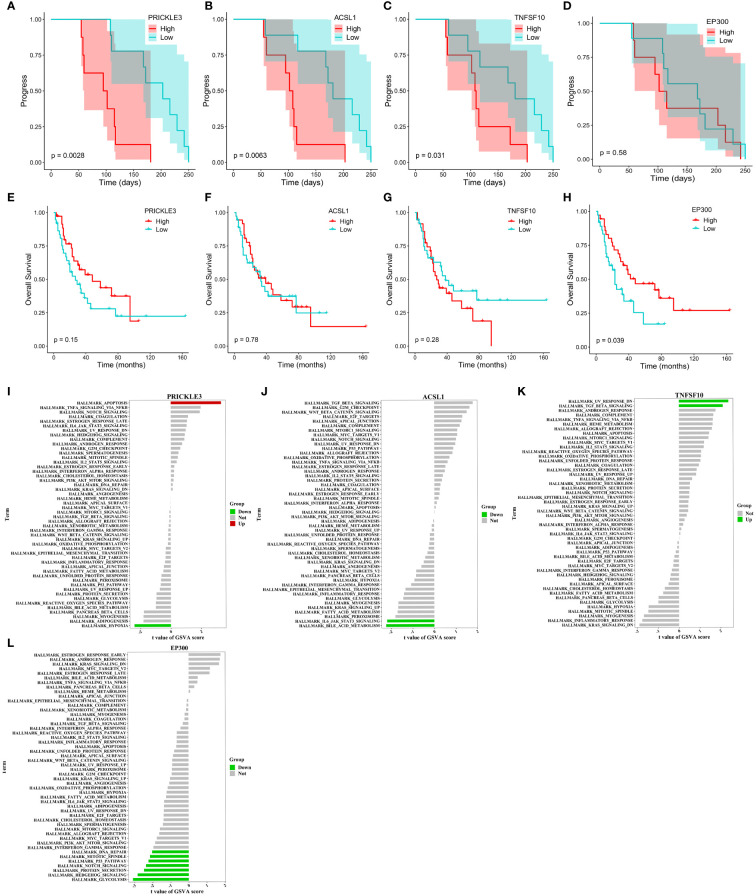
Figure 4.
Progression, survival and GSVA analysis of hub genes in primary resistance. (A-D) Kaplan-Meier curve of PRICKLE3, ACSL1, TNFSF10 and EP300 with progression time. (E-H) Kaplan-Meier curve of PRICKLE3, ACSL1, TNFSF10 and EP300 with overall survival time. (I-L) GSVA of PRICKLE3, ACSL1, TNFSF10 and EP300.

