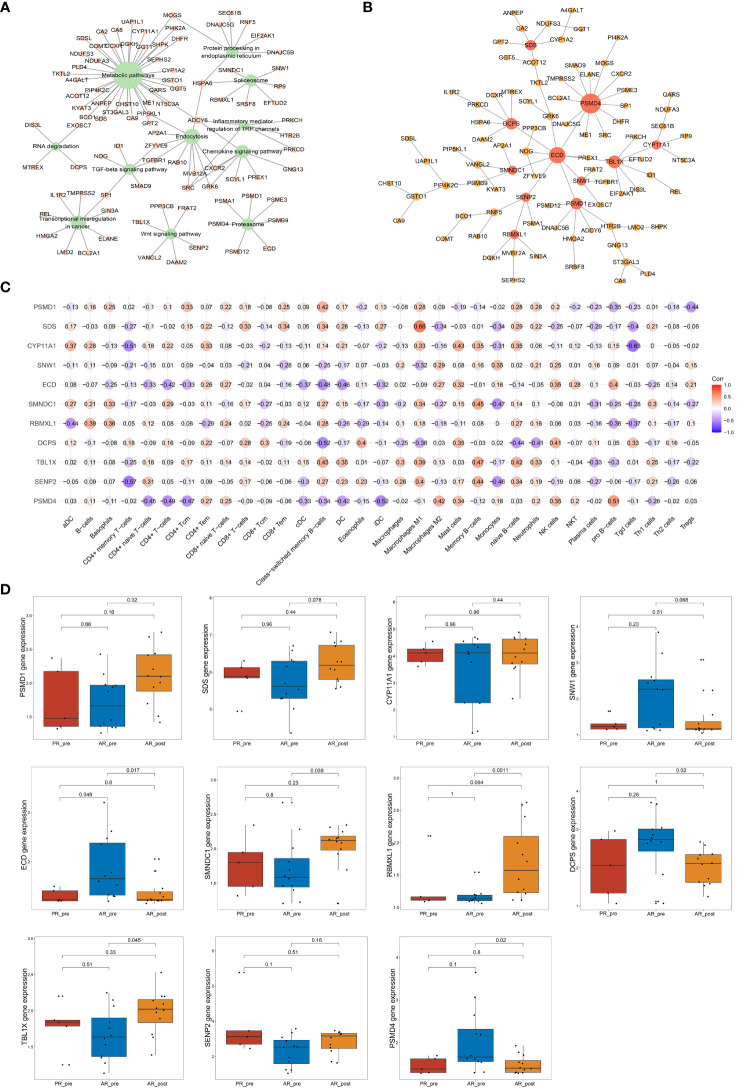
Figure 6.
Network analysis of key hub genes in acquired resistance. (A) Network plot showing DEGs between AR_pre and AR_post groups associated with cancer-related KEGG pathways. (B) Network depicting co-expressed DEGs between AR_pre and AR_post groups within cancer-associated KEGG pathways following WCGNA and MST analysis. (C) Correlation analysis between PSMD4, SENP2, TBL1X, DCPS, PBMXL1, SMNDC1, ECD, SNW1, CYP11A1, SDS, and PSMD1 expression and immune cells. (D) PSMD4, SENP2, TBL1X, DCPS, PBMXL1, SMNDC1, ECD, SNW1, CYP11A1, SDS, and PSMD1 expression between PR_pre, AR_pre and AR_post groups.

