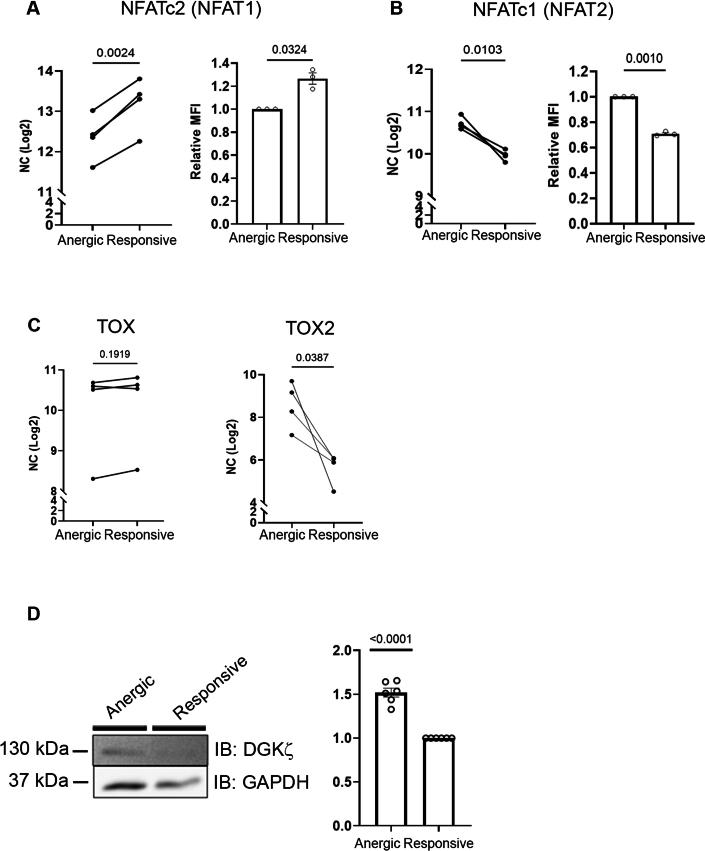
Figure EV2. RNA seq analysis and DGKα expression levels.
(A, B) Transcript level by RNA seq (left) (n = 4, healthy donors used to obtain the pNK) and protein expression (n = 3 healthy donors) via flow cytometry (right) of (A) NFAT1 (NFATc2) and (B) NFAT2 (NFAT c1), respectively. The P value was calculated using a two-tailed t test, and the number of repeats is indicated within the graph presented as means ± SEM. (C) The transcript levels of TOX and TOX2 in anergic vs responsive cells (n = 4, where n is the number of healthy donors used to obtain the pNK cells). P values were calculated using a two-tailed t test with pairing and are indicated within the graph; NC normalized counts. (D) Purified anergic and responsive NK cells were lysed and subjected to western blot analysis with DGKα antibody (n = 6, where n is the number of healthy donors used to obtain the pNK cells). P values were calculated using a two-tailed t test with pairing, and are indicated within the graph presented as means ± SEM. Source data are available online for this figure.

