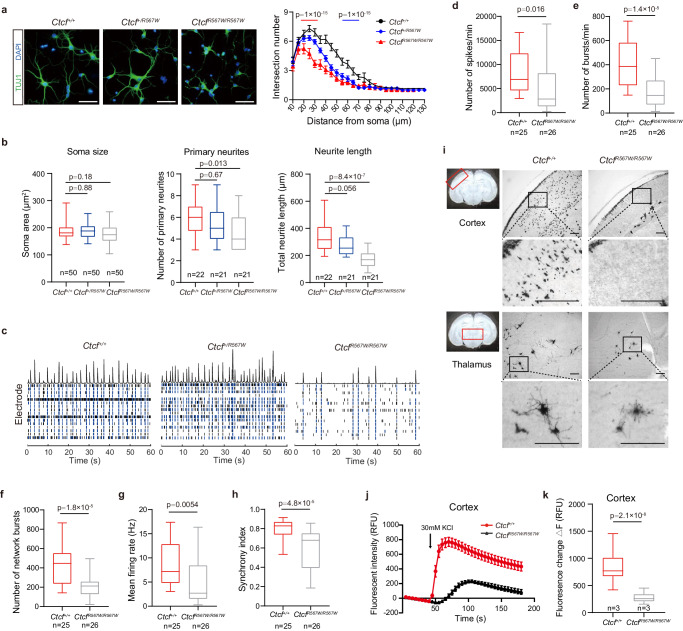
Fig. 2. CTCFR567W homozygous mutation impairs neural development and electrical activity.
a TUJ1 (green) immunostaining and Sholl analysis of primary neurons cultured for 5 days from E18.5 mouse forebrains (n = 3 for each genotype). Nuclei were stained with DAPI (blue). Scale bars, 50 μm. b Quantification of soma sizes (left), the number of primary neurites (middle) and total neurite length (right) of primary neurons from (a) (n = 3 for each genotype, the n of neurons counted are indicated in the graph). c The raster image of MEA experiments showing electrical activity of cultured neurons from three genotypes over a time period (60 s) on day 14. Black and blue bars represent spikes and bursts, respectively. The top of the raster plot shows the spike histogram. d–h Quantification of MEA metrics of Ctcf+/+ and CtcfR567W/R567W cultured neurons. Statistics of electrical activity for 15 min, including the number of spikes per min (d) the number of bursts per min (e) the number of network bursts (f) the mean firing rate (g) and the synchrony index (h) are provided (Ctcf+/+: n = 4, CtcfR567W/R567W: n = 2; the n of cultured wells recorded are indicated in the graph). i Golgi staining of brain slices at the cortex (top) or thalamus (bottom) from Ctcf+/+ and CtcfR567W/R567W mice at E18.5. Scale bars, 100 μm. Areas of interest are indicated by red rectangles. j, k Calcium influx after depolarization from in vitro-cultured cortical neurons on day 10 for Ctcf+/+ and CtcfR567W/R567W mice (n = 3 for each genotype) (RFU: relative fluorescence units). Data from the Sholl analysis are presented as mean ± SEM, and other quantitative data are presented as mean ± SD. p-values by two-way ANOVA with repeated measures (a), one-way ANOVA with Dunnett’s multiple comparisons test adjustment (b), and two-tailed unpaired t-test (d–h and k) are indicated in the graphs. Experiments were repeated three times independently with similar results. All Box and whisker plots show lower and upper quartiles (box limits), median (center line) and minimum to maximum values (whiskers), representing 95% confidence intervals. Source data are provided as a Source Data file.

