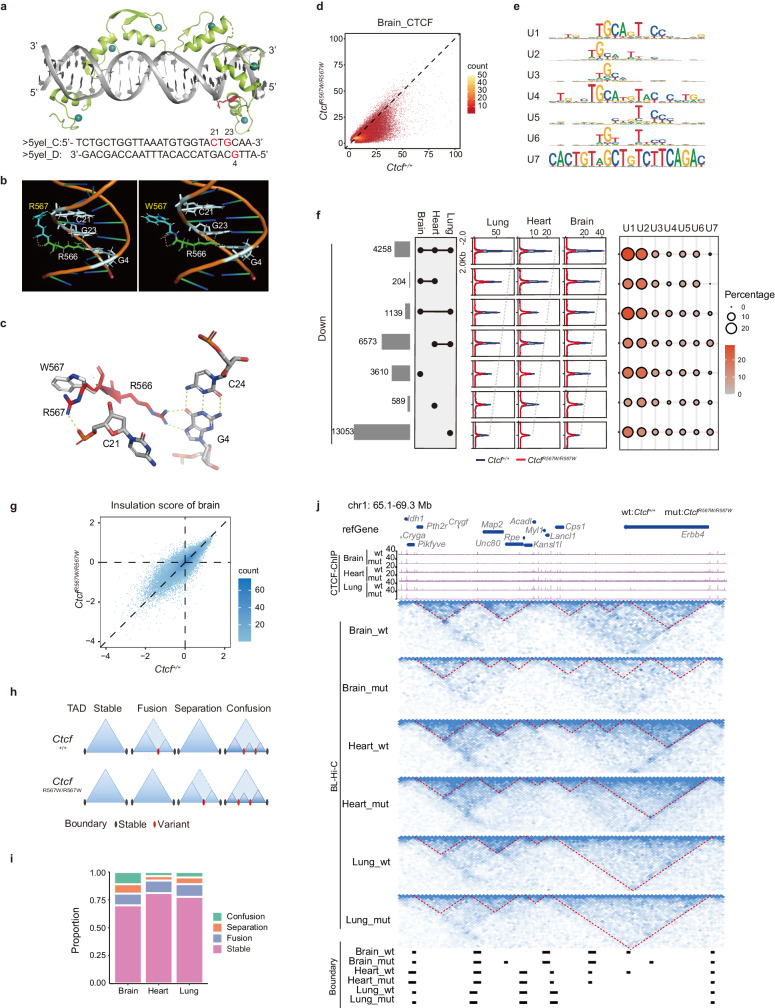
Fig. 4. CTCFR567W weakens CTCF binding to sites containing upstream motifs and locally reorganizes higher-order chromatin structures.
a Crystal structure of the CTCF ZFs6–11-gb7CSE (CTCF-binding conserved sequence element within Pcdhγb7 promoter) complex obtained from PDB: 5YEL28 showing Zn2+ ions in cyan, DNA in gray, ZFs6–11 in green, and the R567 residue in red. Corresponding DNA sequences are shown at the bottom. b Molecular dynamic simulations of the CTCF-DNA complex. Wild-type and R567W mutant structures with R567/W567 residues are shown in blue and with R566 residues in green. Structures also show hydrogen bonding (yellow dashed lines) between R566/R567 and DNA bases C21, G23, and G4 (gray). C: cytosine; G: guanine. c Overlay of wild-type (red) and R567W mutant (white) CTCF-DNA structures showing changes in hydrogen bonding (yellow dashed lines) between the R567/W567 residue and surrounding DNA bases and phosphate backbone upon mutation. Structures of (a–c) were visualized using the PyMoL Molecular Graphics System91. Hydrogen bonds are shown as dashed lines. d Comparison of normalized CTCF binding strength for brain tissues between Ctcf+/+ and CtcfR567W/R567W mice. e CTCF U motifs of downregulated CTCF sites derived from Supplementary Fig. 7f. f Overlap analysis of downregulated CTCF binding sites (log2(fold change of Ctcf+/+/CtcfR567W/R567W) > 1) in brain, heart and lung tissues (left). Average CTCF binding strengths (middle) and ratios of different types of U motifs (right) were analyzed for each set of overlapping peaks. g Comparison of genome-wide insulation scores in brain tissues between Ctcf+/+ and CtcfR567W/R567W mice. The color in the plot represents the density of points. h Models depicting different types of TADs caused by the CTCFR567W mutation. i Bar plot showing proportions of different types of TADs in brain, heart, and lung tissues. j Hi-C and CTCF ChIP-seq tracks illustrating the stable and variant TADs among brain, heart and lung tissues between Ctcf+/+ and CtcfR567W/R567W mice. TAD boundaries identified for each tissue are shown at the bottom.

