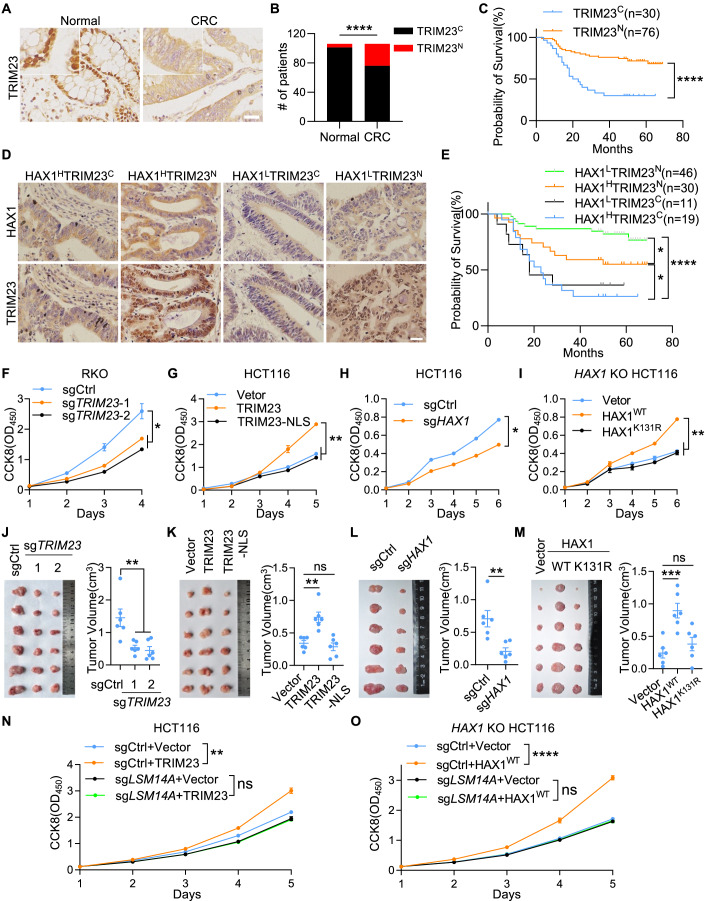
Figure 8. Ubiquitinated HAX1 is critical for the tumorigenicity of CRC.
(A) Immunohistochemical staining of TRIM23 in normal adjacent tissues and CRC tissues. Scale bars, 25 μm (inset, 12.5 μm). (B) Quantification of the localization of TRIM23 in (A). Superscript C, cytoplasmic location; Superscript N, nuclear location. ****P < 0.0001 (Chi-Squared test). (C) Kaplan–Meier survival analysis of the CRC patients in (A). ****P < 0.0001 (Log-rank test). (D) Immunohistochemical staining of TRIM23 and HAX1 in CRC tissues (Superscript H, high; Superscript L, low). Scale bars, 25 μm. (E) Kaplan–Meier survival analysis of the CRC patients in (D). *P < 0.05, ****P < 0.0001 (Log-rank test). (F–I) The proliferation of control or TRIM23 knockout RKO cells (F), HCT116 cells transduced with lentivirus expressing vector, TRIM23 or TRIM23-NLS (G), control and HAX1 knockout HCT116 cells (H), or HAX1 KO HCT116 cells transduced with lentivirus expressing control, HAX1WT, or HAX1K131R (I) were determined by CCK8 assay. At least two biological replicates are plotted as the mean ± SD. *P < 0.05, **P < 0.01 (Student’s t test). (J–M) Xenograft tumor formation by the indicated CRC cells in mice. Tumor images (left) and tumor volume (right) are shown (n = 6 animals). Error bars indicate SEM. ns: no significance, **P < 0.01, ***P < 0.001 (Student’s t test). (N, O) Control or TRIM23-overexpressing HCT116 cells (N) or HAX1 KO HCT116 cells expressing control or HAX1 (O) were transduced with control or LSM14A sgRNA. The proliferation of indicated cells was determined by CCK8 assay. Three biological replicates are plotted as the mean ± SD. ns: no significance, **P < 0.01, ****P < 0.0001 (two-way ANOVA). Source data are available online for this figure.

