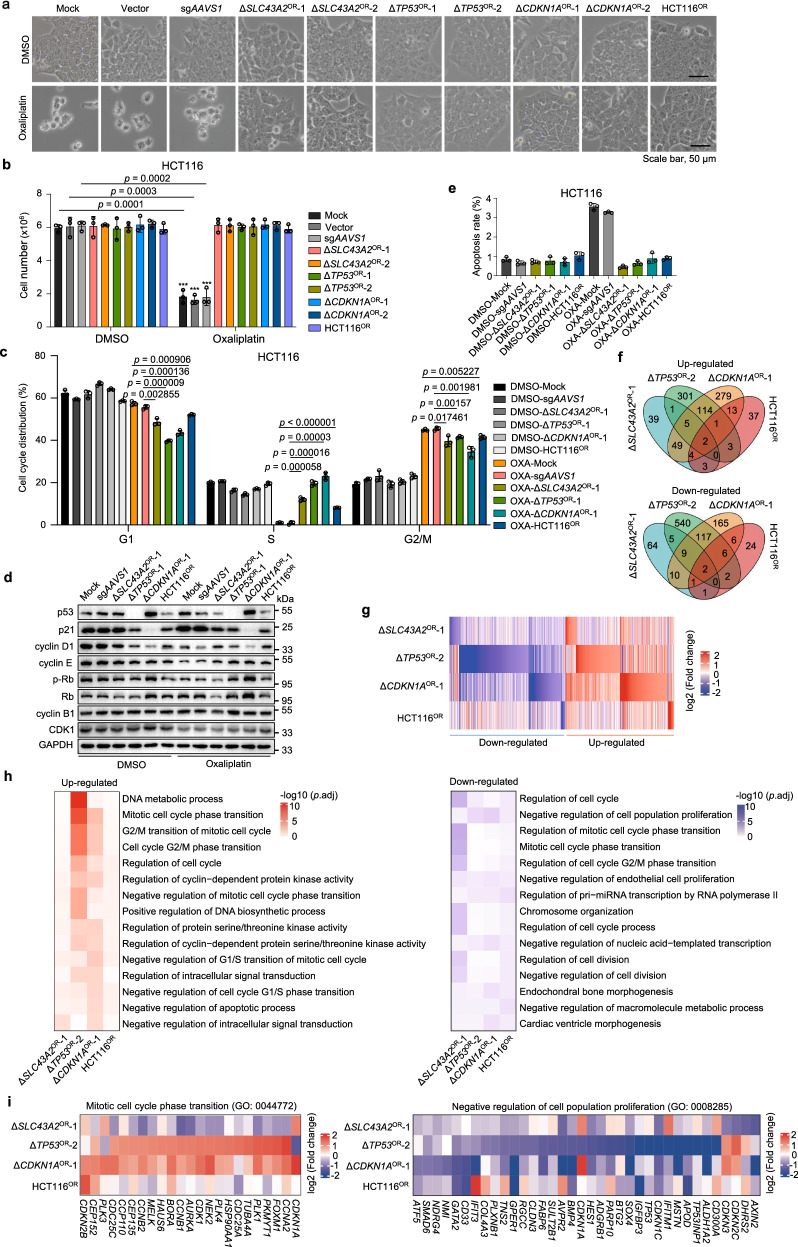
Fig. 4. Cellular and molecular features of oxaliplatin-resistant cells.
a Cell morphology of multiple oxaliplatin-sensitive (Mock, Vector, and sgAAVS1 groups) and -resistant cell lines in the absence or presence of 5 μM oxaliplatin for 6 days. Scale bar, 50 μm. b Cell number quantification of indicated oxaliplatin-sensitive and -resistant cell lines after 7 days of oxaliplatin treatment. Mean ± SD with n = 3 biological replicates. Unpaired two-sided t test (oxaliplatin vs. DMSO) for p value. c Cell cycle analysis by propidium iodide (PI) staining of indicated cell lines in the absence or presence of 5 μM oxaliplatin for 48 h. OXA, oxaliplatin. Mean ± SD with n = 3 biological replicates. Unpaired two-sided t test for p value. d Immunoblot analysis of indicated proteins for multiple oxaliplatin-sensitive or -resistant HCT116 cell lines in the absence or presence of 5 μM oxaliplatin for 48 h. e Apoptosis analysis by PI and Hoechst staining of indicated cell lines in the absence or presence of 5 μM oxaliplatin for three days. Mean ± SD with n = 3 biological replicates. f Venn diagram of differentially expressed genes (ΔSLC43A2OR-1, ΔTP53OR-1 or ΔCDKN1AOR-1 vs. sgAAVS1; HCT116OR vs. untreated Mock) in four indicated oxaliplatin-resistant HCT116 cell lines determined by RNA-seq analysis. g Heatmap showing differentially expressed genes in four indicated oxaliplatin-resistant HCT116 cell lines. h Functional enrichment analysis showing the prominently enriched terms among differentially expressed genes in four oxaliplatin-resistant HCT116 cell lines. Unpaired two-sided t test for p value with Benjamini–Hochberg (BH) adjustment. i Highlight of individual genes within indicated functional terms across the four oxaliplatin-resistant cell lines.

