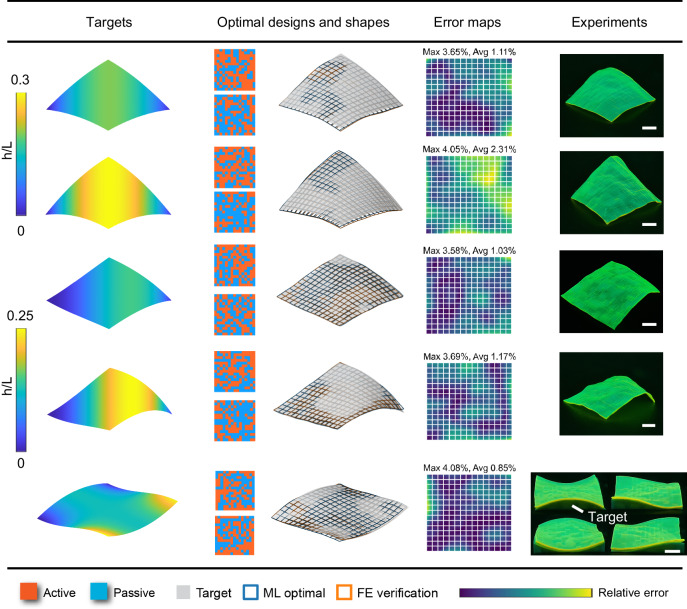
Fig. 6. Inverse design results for the algorithmically generated target shapes.
From left to right: target surfaces, optimal designs, the corresponding actuated shapes predicted by ML (blue grid) and FE (orange grid) plotted against the target (gray surface), approximation error maps of the actuated shapes by FE with the maximum and average error values (relative to the edge length), and experimentally 4D-printed, actuated shapes of the optimal designs. In experiments of row 5, the target shape is 3D-printed to facilitate the comparison. All scale bars: 10 mm.

