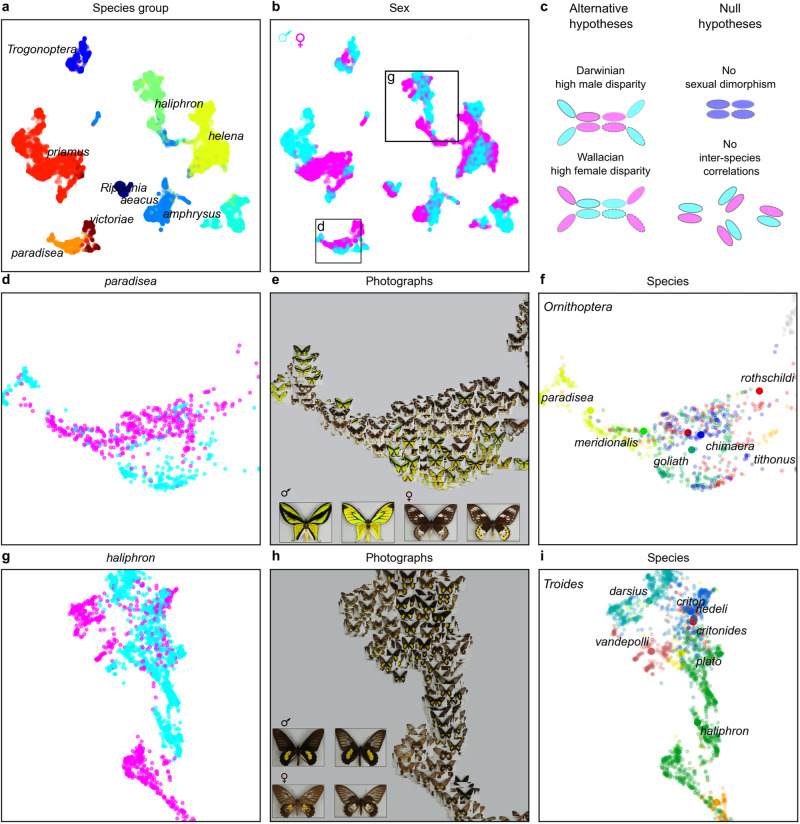
Fig. 2. Patterns of phenotypic similarity in birdwing species groups and sexes.
Late structure of machine-learnt embedding trained for 2990 epochs (n = 16,734 images, as for Fig. 1). Structure of species groups (a) and sexes (b). c Diagram illustrating alternative and null evolutionary hypotheses (clusters for each species represented by ovals sharing border colour). d–i, Exemplar species groups showing inverted patterns of sexual disparity (d, g, sexes; e, h, photographs; f, i, species). d–f Ornithoptera paradisea species group showing clustered females with peripheral males (neighbour-joining clade depth females 0.32, males 0.53). g–i Troides haliphron species group showing clustered males with peripheral females (clade depth females 1.0, males 0.31). Large inset photographs show examples of male and female, dorsal (left) and ventral (right) for O. paradisea (e) and T. haliphron (h).

