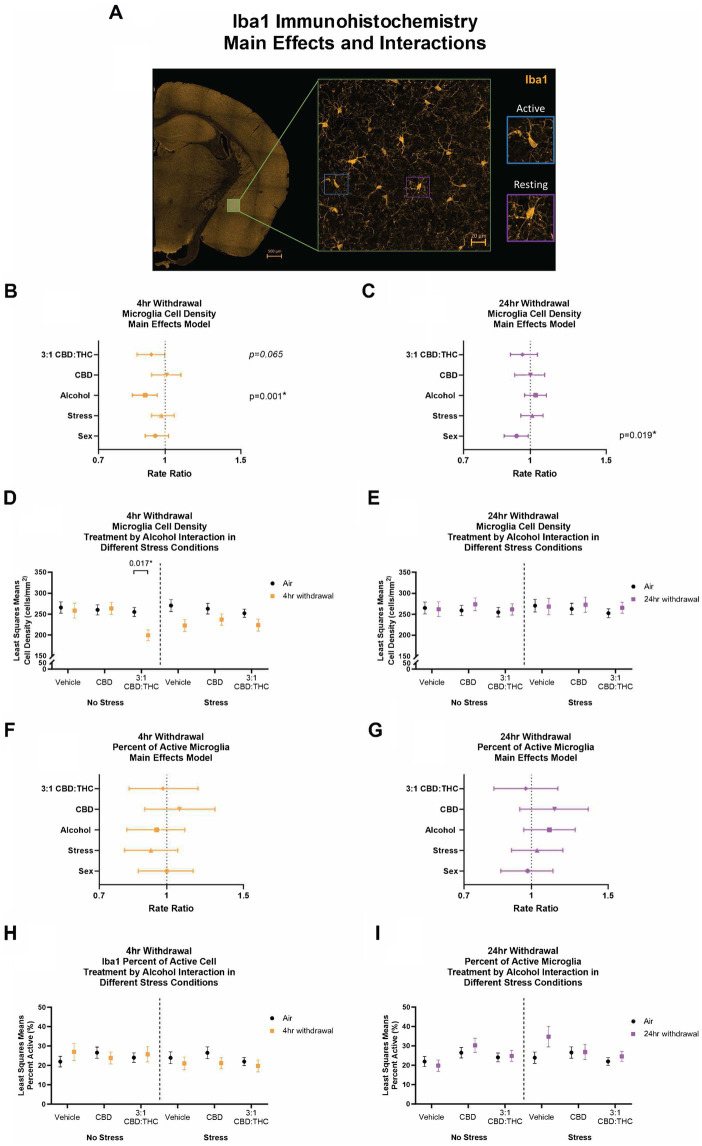
Figure 9.
Main effects and interactions model between air control group and each of the withdrawal time groups in the density of Iba1+ microglial cells and the percent of active microglial cells. (A) Representative image of CeA location and Iba1+ cells. Examples of active and resting microglia are portrayed on the right side of the image. (B) Main effects of microglial cell density for treatment, alcohol, stress, and sex in 4-h withdrawal. The x-axis on a log10 scale has been modified to better visualize the data. (C) Main effects of microglial cell density for treatment, alcohol, stress, and sex in 24-h withdrawal. The x-axis on a log10 scale has been modified to better visualize the data. (D) Treatment by alcohol interaction of microglial cell density stratified by stress in 4-h withdrawal. (E) Treatment by alcohol interaction of microglial cell density stratified by stress in 24-h withdrawal. (F) Main effects of percent of active microglia for treatment, alcohol, stress, and sex in 4-h withdrawal. The x-axis on a log10 scale has been modified to better visualize the data. (G) Main effects of percent of active microglia for treatment, alcohol, stress, and sex in 24-h withdrawal. The x-axis on a log10 scale has been modified to better visualize the data. (H) Treatment by alcohol interaction of percent of active microglial cells stratified by stress in 4-h withdrawal. (I) Treatment by alcohol interaction of percent of active microglial cells stratified by stress in 24-h withdrawal. The p-values represent values of a statistical test of differences between the least square means outcome values for those combinations of explanatory factors. p < 0.05 is considered significant. Data is collected from at least 6 mice per group and is averaged across both hemispheres between 2 brains slices per mouse.

