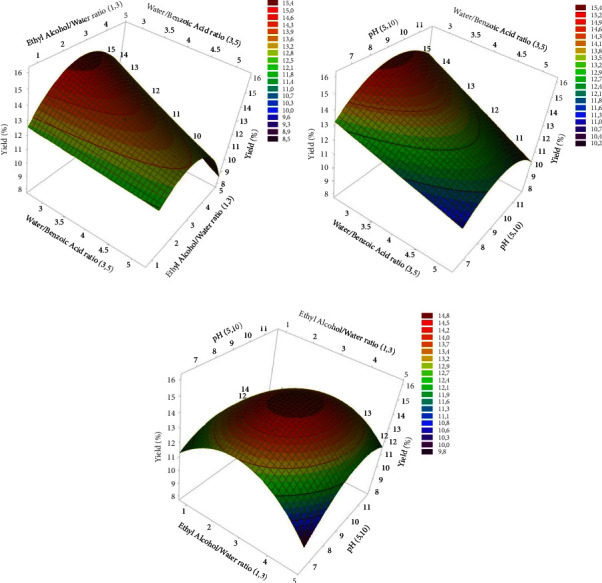
Figure 4.

Graphical representation of 3D response surface plots illustrating the interactive effects of key variables on yield (%) of flaxseed gum. (a) Surface plot for variation in water/benzoic acid ratio and ethyl alcohol/water ratio. (b) Surface plot for variation in water/benzoic acid ratio and pH. (c) Surface plot for the variation in ethyl alcohol/water ratio and pH.
