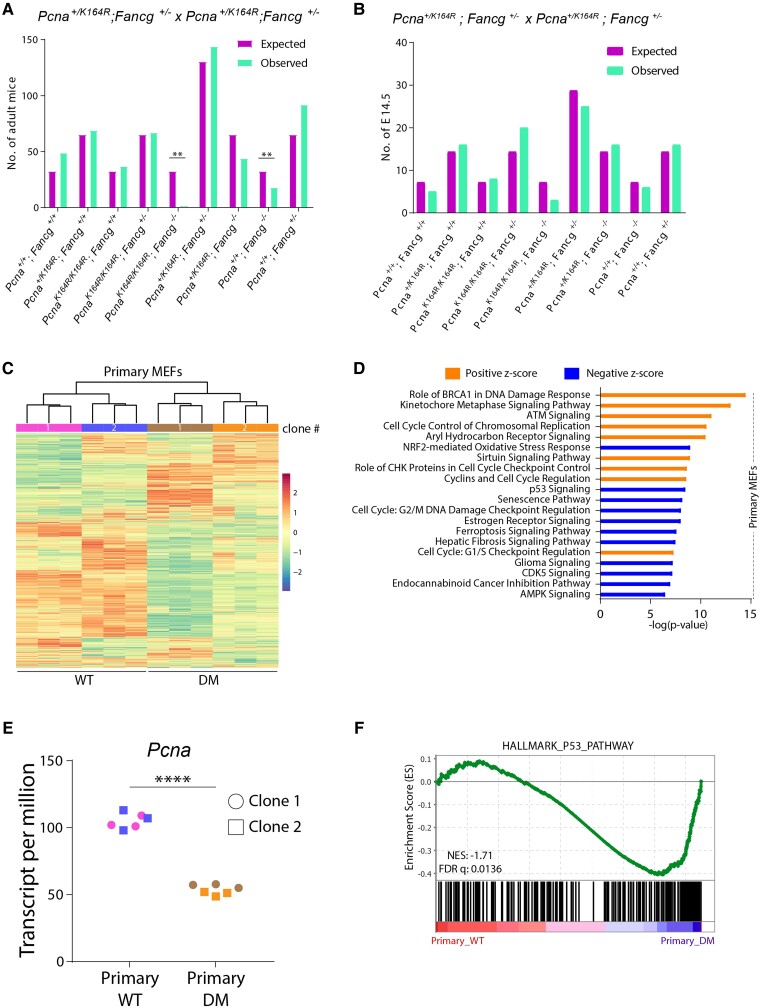
Fig. 1.
A combined DDT and FA defect increases cell cycle stress and cell death in pMEFs. A) Observed and expected numbers of offspring obtained from Pcna+/KR; Fancg+/− intercrosses. P-values were calculated using Pearson's Chi-square test, **P < 0.01. B) Observed and expected numbers of E14.5 embryos obtained from timed mating of PCNA+/KR; FG+/− intercrosses. C) Heatmap showing unsupervised clustering of all genes expressed in two independent clones of WT and DM pMEFs as determined by RNA sequencing. Each MEF clone was sequenced in three technical replicates. D) RNA-seq data from WT and DM pMEFs were analyzed using IPA (right-tailed Fisher's exact test; FDR < 0.05). Graph displays top 15 canonical pathways that have a positive or negative Z-score. The Z-score indicates predicted pathway activation or inhibition. E) Graph displays Pcna TPM counts from clones shown in C. P-values were calculated using one-way ANOVA. ****P < 0.0001. F) GSEA comparing transcriptomes of WT and DM pMEFs using the hallmark p53 gene set. Normalized enrichment score (NES) and FDR are indicated.

