Fig. 2.
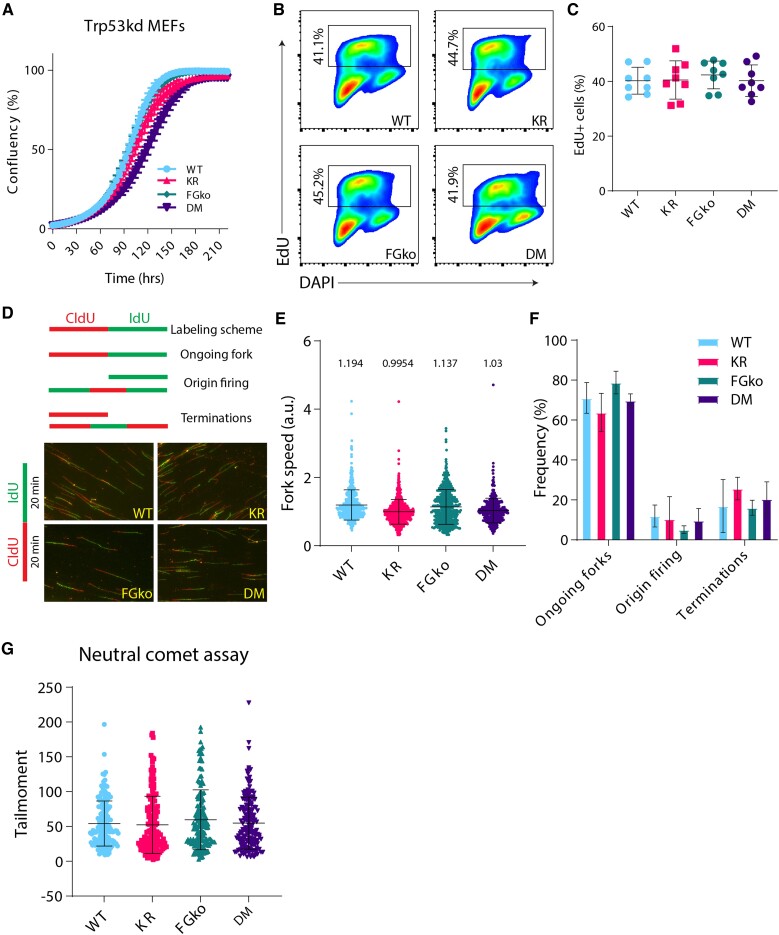
Trp53kd KR; FGko MEFs have a normal proliferation and cell cycle profile. A) Trp53kd cell lines were seeded at 250 cells/well in a 96-well plate, and cell confluency was measured every 4 hours using IncuCyte live cell imaging system from two independent experiments. Dots at each timepoint indicate mean, and bars represent SD. B) Representative flow cytometry plots showing gating strategy to identify and compare EdU-positive population in Trp53kd MEFs cultured under standard conditions. Cells in S-phase were revealed by EdU incorporation for 20 minutes before harvesting and fixed in 70% ethanol. In addition, the DNA stain DAPI was used as a cell cycle marker to distinguish G1 from G2/M cells. C) Quantification of EdU-positive cells from two independent experiments. Each dot indicates a sample, and bars represent mean ± SD. D) Schematic representation of different replication fork structures (45) identified after pulse labeling with CldU (red) and IdU (green) (upper panel). Representative images of DNA fibers from Trp53kd MEFs (lower panel). Cells were pulse-labeled with CldU and IdU for 20 minutes each. Ongoing forks were used to calculate fork speed (kb/min). E) Replication fork speeds from Trp53kd MEFs cultured under standard conditions. Each dot represents an ongoing fork. At least 350 track lengths of ongoing forks were measured (from three independent experiments) with ImageJ. Bars represent mean ± SD. F) Quantification of ongoing forks, origin firing, and terminations as a frequency of all replication fork structures identified in fiber images used in E. G) Quantification of tail moments from Trp53kd MEFs as determined by neutral comet assay (technical replicates = 50, n = 3). Bars represent mean ± SD. Tail moments were obtained using CASP software.

