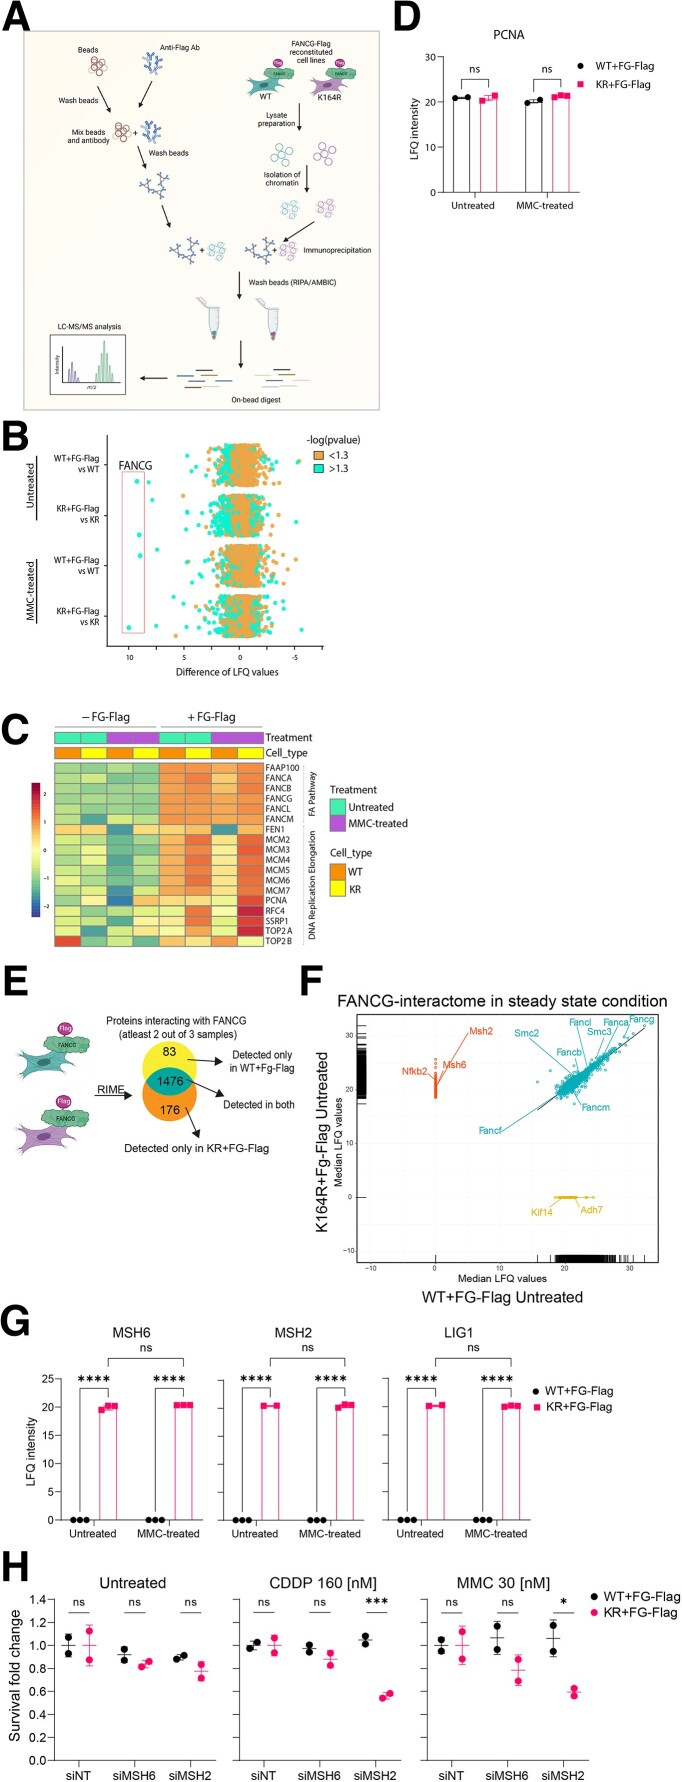
Fig. 4.
PCNA-Ub facilitates FA repair and prohibits recruitment of MMR. A) Schematic displaying the steps involved in RIME. Figure was made with BioRender.com. B) Scatterplot depicting enrichment of WT + FG-Flag and KR + FG-Flag RIME experiments over their respective nonreconstituted controls under both untreated and MMC-treated conditions. FANCG is highly enriched (LFQ > I7.5I) under all FG-Flag-containing conditions. n = 3. Cells were either left untreated or treated for 16 hours with 1.5 µM MMC. C) Heatmap depicting mean LFQ intensity in nonreconstituted and FG-Flag-reconstituted WT and KR cell lines for proteins detected from the “Fanconi anemia pathway” and “replication elongation” clusters as defined by Räschle et al. (32). D) Graph displaying raw LFQ intensities of PCNA in untreated and MMC-treated WT + FG-Flag and KR + FG-Flag RIMEs. Bars represent mean ± SD. P-values were calculated using two-way ANOVA. E) Schematic displaying the steps involved in analysis of the RIME data. F) Regression plot displaying median LFQ values for proteins detected in two out of three samples in the untreated WT + FG-Flag and KR + FG-Flag RIMEs. Upon IP on FG-Flag, proteins were enriched in KR only (upper left cluster), WT only (lower right cluster), or both (diagonal cluster) RIMEs. G) Graph displaying raw LFQ intensities of MSH2, MSH6, and LIG1 in untreated and MMC-treated WT + FG-Flag and KR + FG-Flag RIMEs. Bars represent mean ± SD. P-values were calculated using two-way ANOVA. *P < 0.05, **P < 0.01, ****P < 0.0001. H) Cells were treated with siRNAs against no target (NT), MSH2, and MSH6 for 6 hours. 48 hours after transfection, cells were plated and subsequently treated with CDDP or MMC or left untreated for 5 days. Crystal violet absorbance was used to determine survival, and fold change was plotted for siMSH2- and siMSH6-treated WT and KR MEFs where data were normalized to the respective siNT controls for all conditions.

