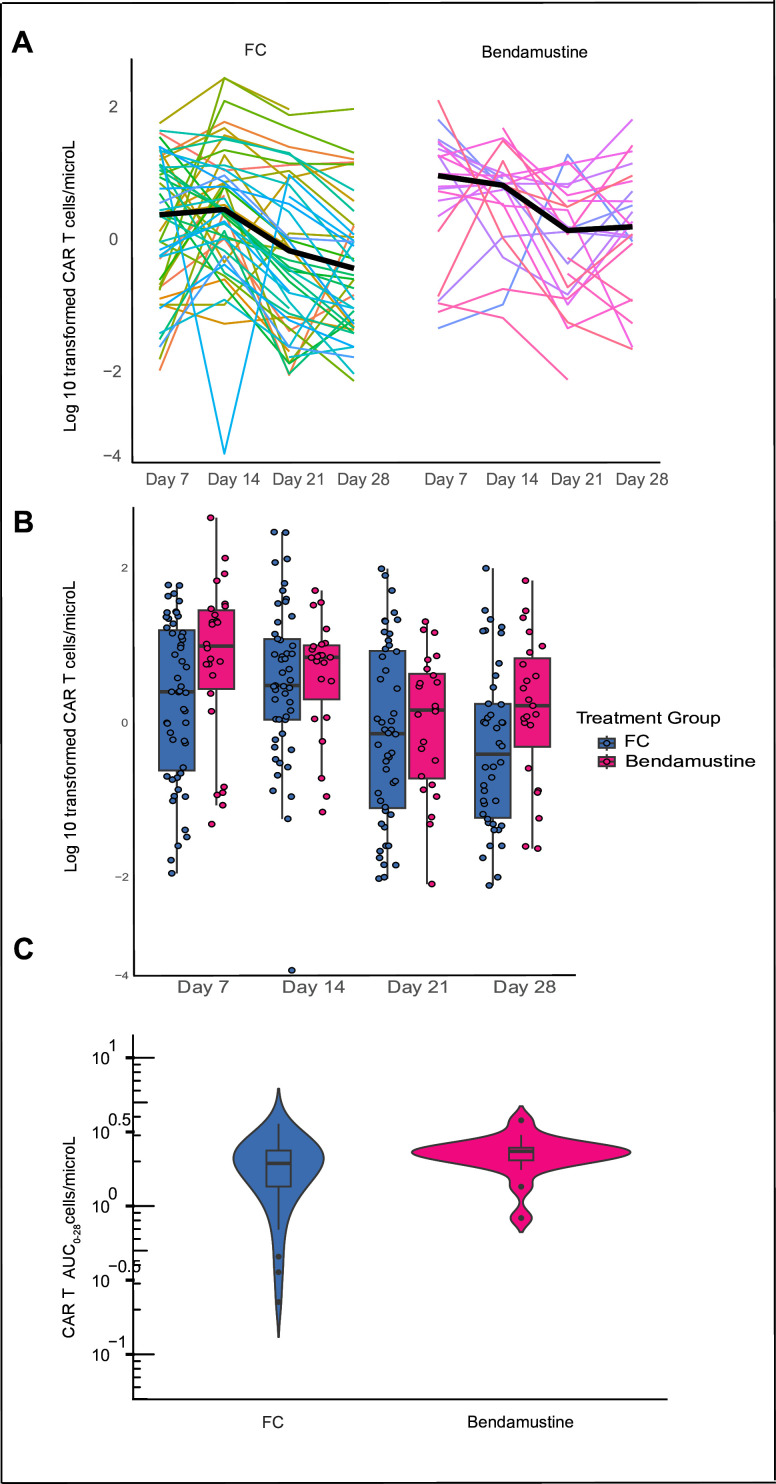
Figure 4.
CAR-T expansion in the first 28 days following axi-cel infusion. (A) Spaghetti plot of patient-level log10-transformed CAR-T expansion over 28 days, stratified. by FC and Bendamustine cohorts. Solid black line represents the median expansion. (B) Box plot of log10-transformed CAR-T expansion at days 7, day 14, day 21 and day 28. Blue represents FC-treated patients and pink represents Bendamustine-treated patients. Each dot represents a patient-level value. (C) Violin plot of area under the curve of log10-transformed CAR-T expansion within in first 28 days following CAR-T infusion using the linear trapezoidal method. Blue represents FC-treated patients and pink represents bendamustine-treated patients.

