Figure 4.
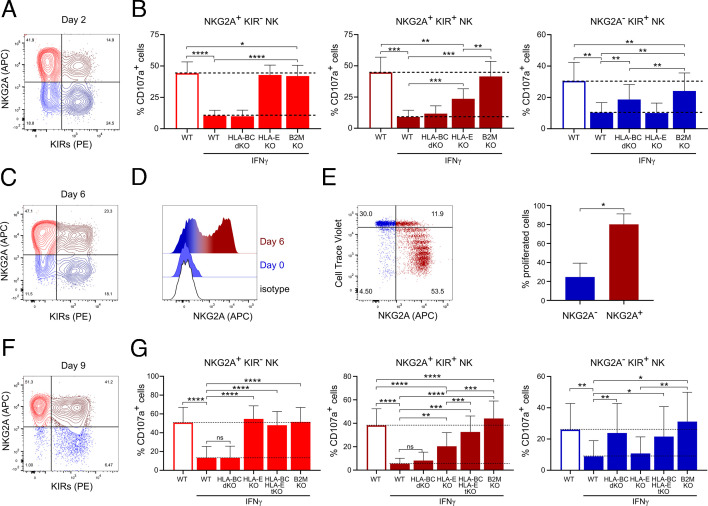
Different inhibition of NKG2A/KIRs NK cell subsets by IFNγ-pretreated A375 cells. (A) Representative dot plot showing the expression of NKG2A and KIRs on NK cells cultured for 2 days in IL-2-containing media. (B) Degranulation of 2 days IL-2-cultured NKG2A/KIRs NK cell subsets after 4 hours of co-culture with WT, HLA-E KO, HLA-BC dKO and B2M KO A375 cells pretreated or not with IFNγ 12 hours before the co-culture (n=7). (C) Expression of NKG2A and KIRs on NK cells cultured for 6 days in IL-2-containing media. (D) Expression of NKG2A on isolated NKG2A- NK cells at days 0 and 6 of culture in IL-2-containing media. (E) Expression of NKG2A and the reduction in Cell Trace Violet (CTV) staining on isolated NKG2A- NK cells cultured for 6 days in IL-2-containing media. NKG2A− NK cells were isolated by depleting of NKG2A+ NK cells using NKG2A magnetic beads, stained with CTV and analyzed after 6 days of culture. NK cell were gated as NKG2A− and NKG2A+ and the percentage of NK cells that have proliferated was quantified (n=3). (F) Representative dot plot showing the expression of NKG2A and KIRs on NK cells cultured for 9 days in IL-2-containing media. (G) Degranulation of 9 days IL-2-cultured NKG2A/KIR NK cell subsets after 4 hours of co-culture with WT, HLA-E KO, HLA-B/C dKO, HLA-BCE tKO and B2M KO A375 cells pretreated or not with IFNγ 12 hours before the co-culture (n=8). Statistical analysis was performed by one-way ANOVA (multiple comparisons) test (B, G) and two-tailed Student’s t-test (E), *p<0.05, **p<0.01, ***p<0.001, ****p<0.0001. ANOVA, analysis of variance; KO, knockout; NK, natural killer; WT, wild-type.

