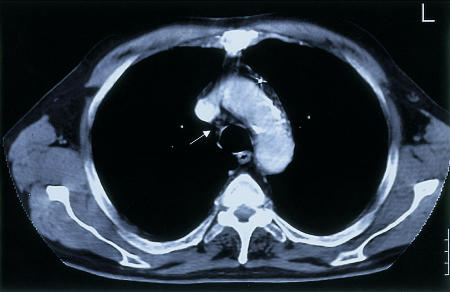
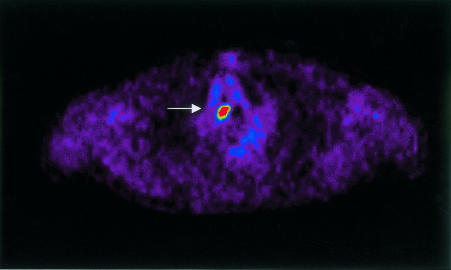
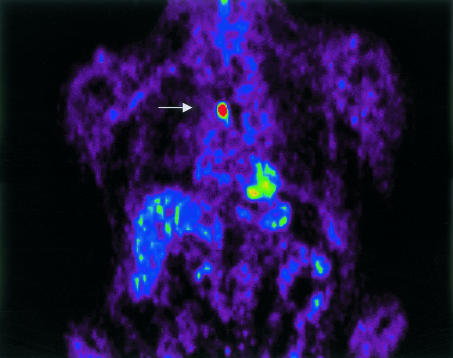
Figure 2.
Computed tomography (CT) and positron emission tomography (PET) findings in a patient with squamous cell carcinoma of the right lung. Top: Level 2 CT. Centre and bottom: Axial and coronal PET respectively of area shown by arrow in CT. No abnormal mediastinal lymph nodes were seen on CT, but uptake of 2-deoxyglucose labelled with 18F was increased on PET (arrows). Reproduced with permission from Pieterman et al24


