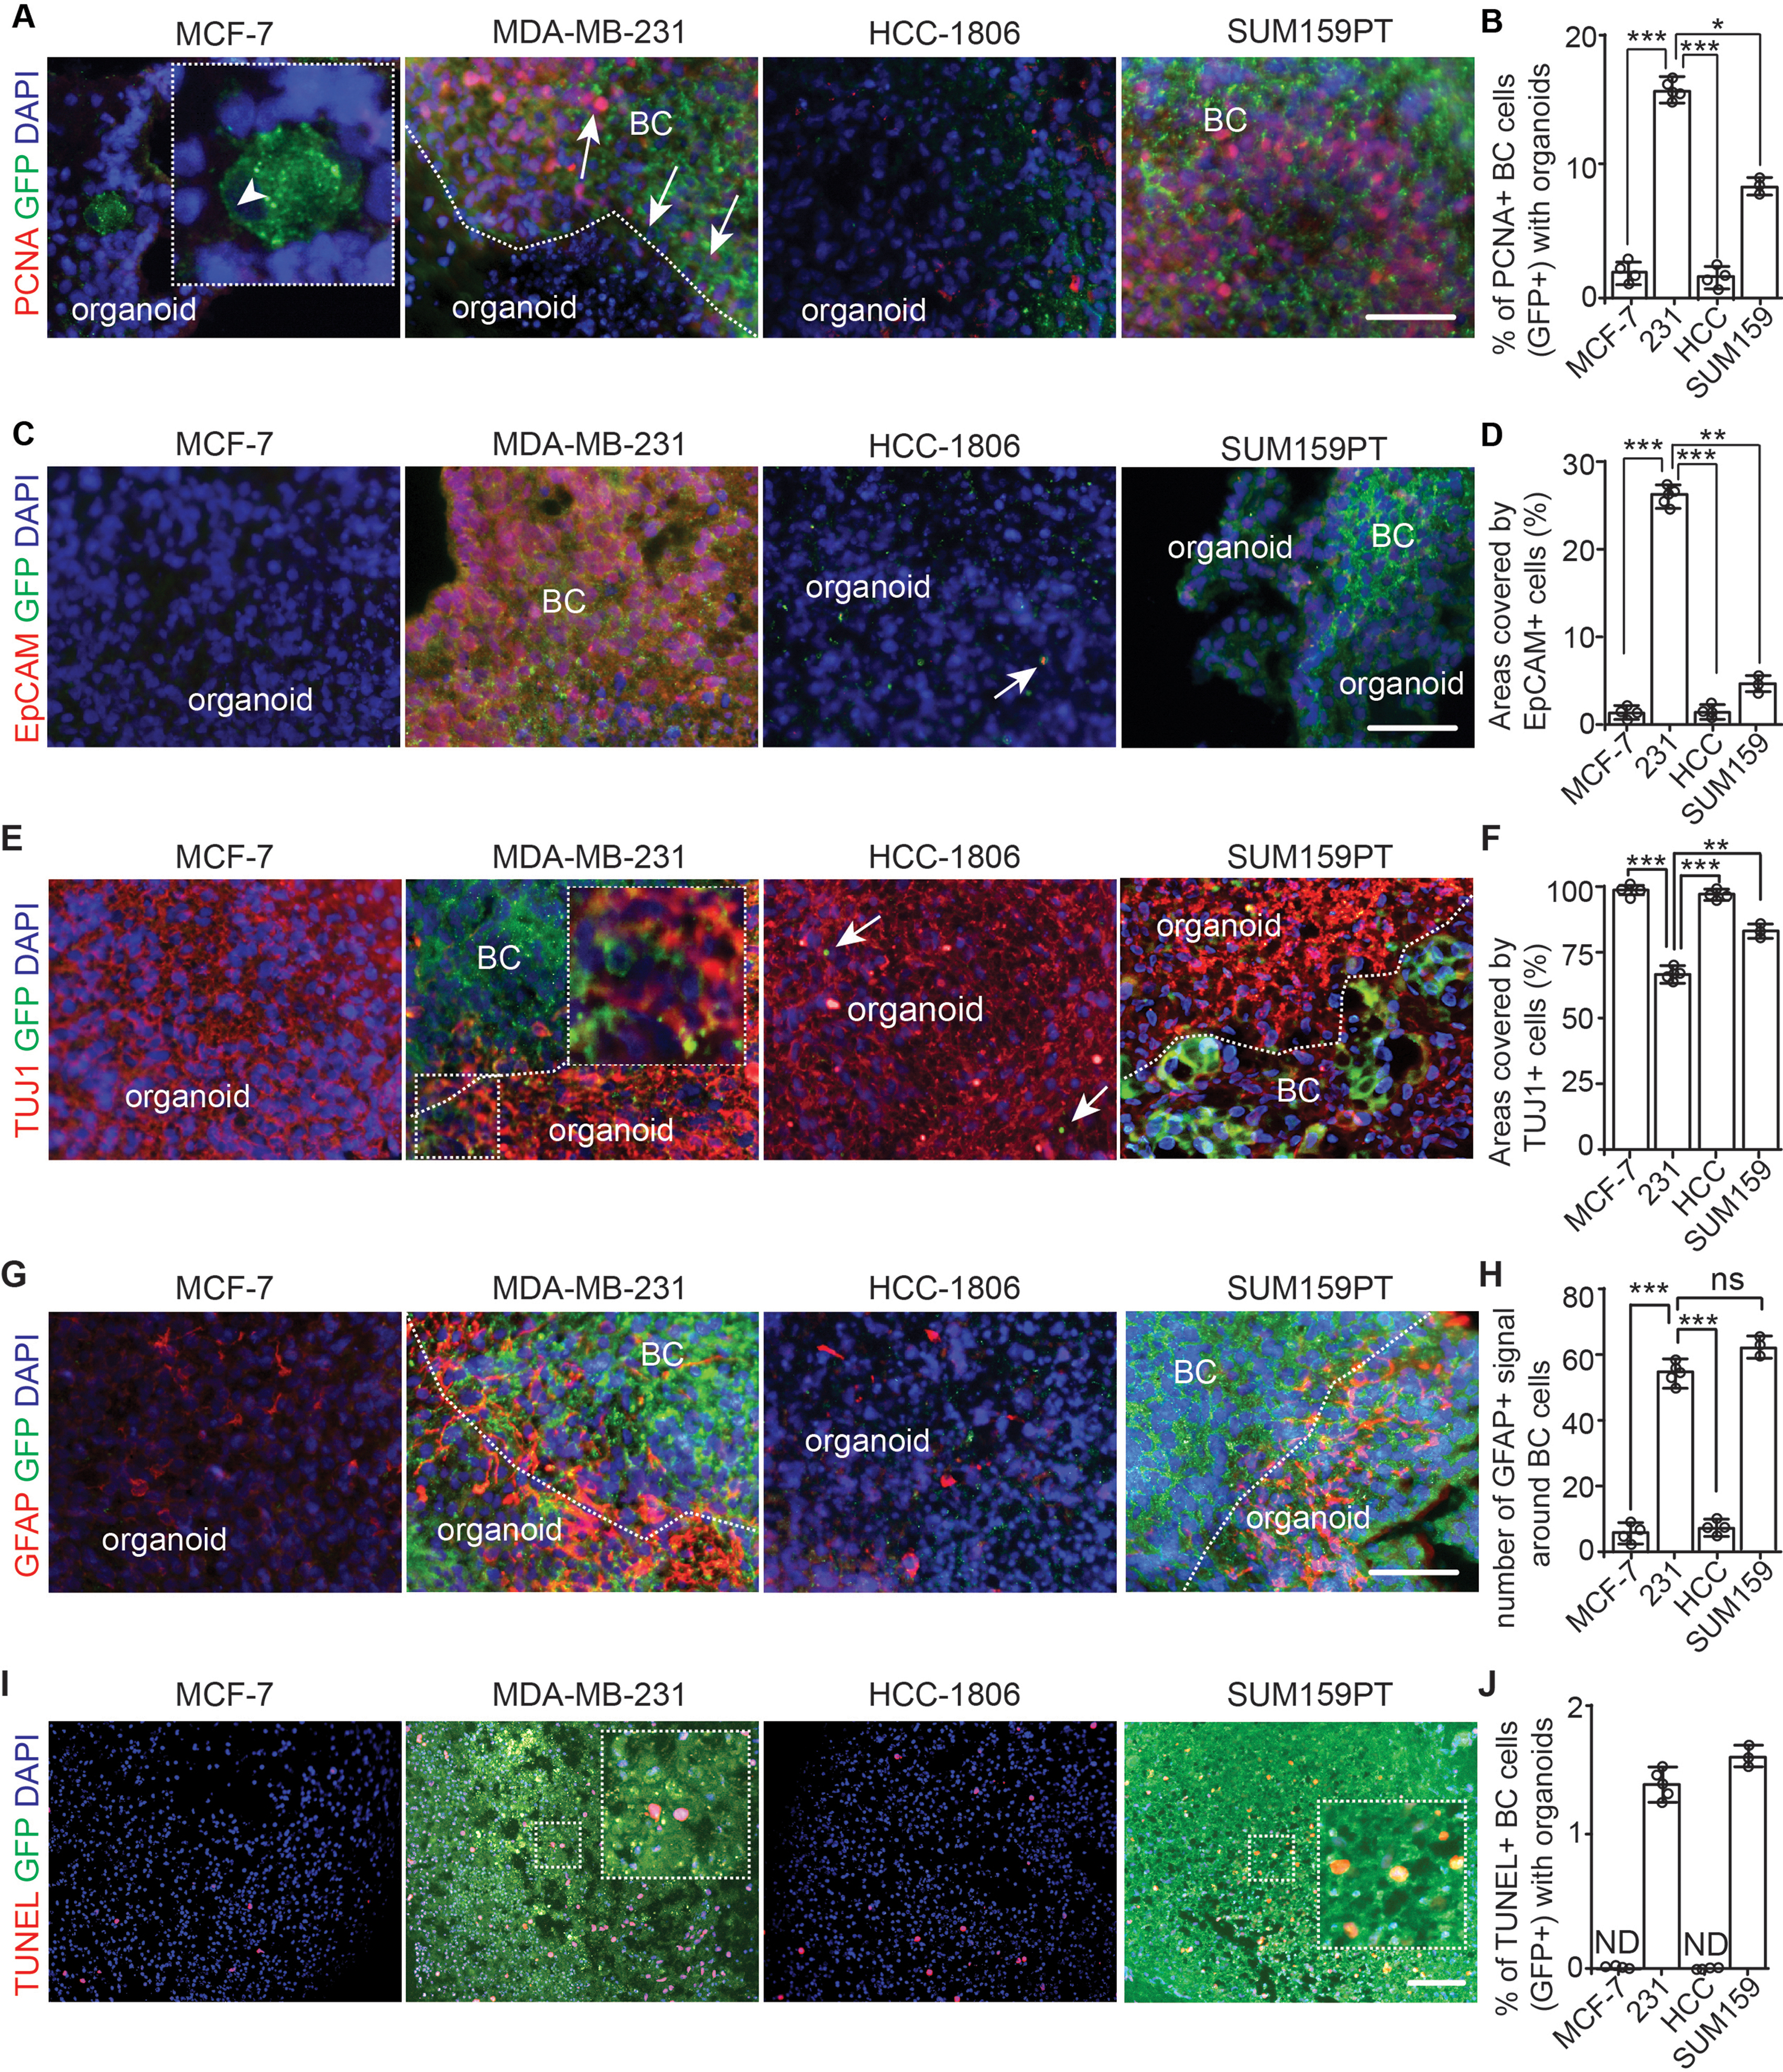
Fig. 4.

Growth of breast cancer cells in cerebral organoids. (A) IF of PCNA and GFP of breast cancer cells co-cultured with organoids at day 14. (B) Mean ± SE of the percentage of PCNA+ proliferative GFP+ breast cancer cells in cerebral organoids. (C) IF of EpCAM and GFP of breast cancer cells co-cultured with organoids. The arrow indicated a dead GFP-HCC-1806 cells in cerebral organoid. (D) Mean ± SE of the areas occupied by EpCAM+ breast cancer cells in cerebral organoids. (E) IF of TUJ1 and GFP of breast cancer cells co-cultured with organoids. Boxed area shown in detail as inset. Arrows indicated apoptotic HCC-1806 cells. (F) Mean ± SE of the percentage of the areas occupied by TUJ1+ cells in co-cultured cerebral organoids. (G) IF of GFAP and GFP of breast cancer cells co-cultured with organoids. (H) Mean ± SE of the number of GFAP+ cells in cerebral organoids around tumor colonies. (I) Fluorescence of TUNEL and DAPI of co-cultured breast cancer cells with organoids. Boxed area shown in detail as inset. (J) Mean ± SE of the percentage of TUNEL+ apoptotic breast cancer cells co-cultured with cerebral organoids. Dashed line indicated the border of breast cancer cells within organoid. Selected areas were shown in detail as inset. Representative images and quantification were from 13–19 cerebral organoids in 4–5 independent experiments. One-way ANOVA was used for statistical analysis. ND: not determined, ns: no significance, *: p < 0.05, **: p < 0.01, ***: p < 0.001. Bar = 100 μm
