Fig. 6.

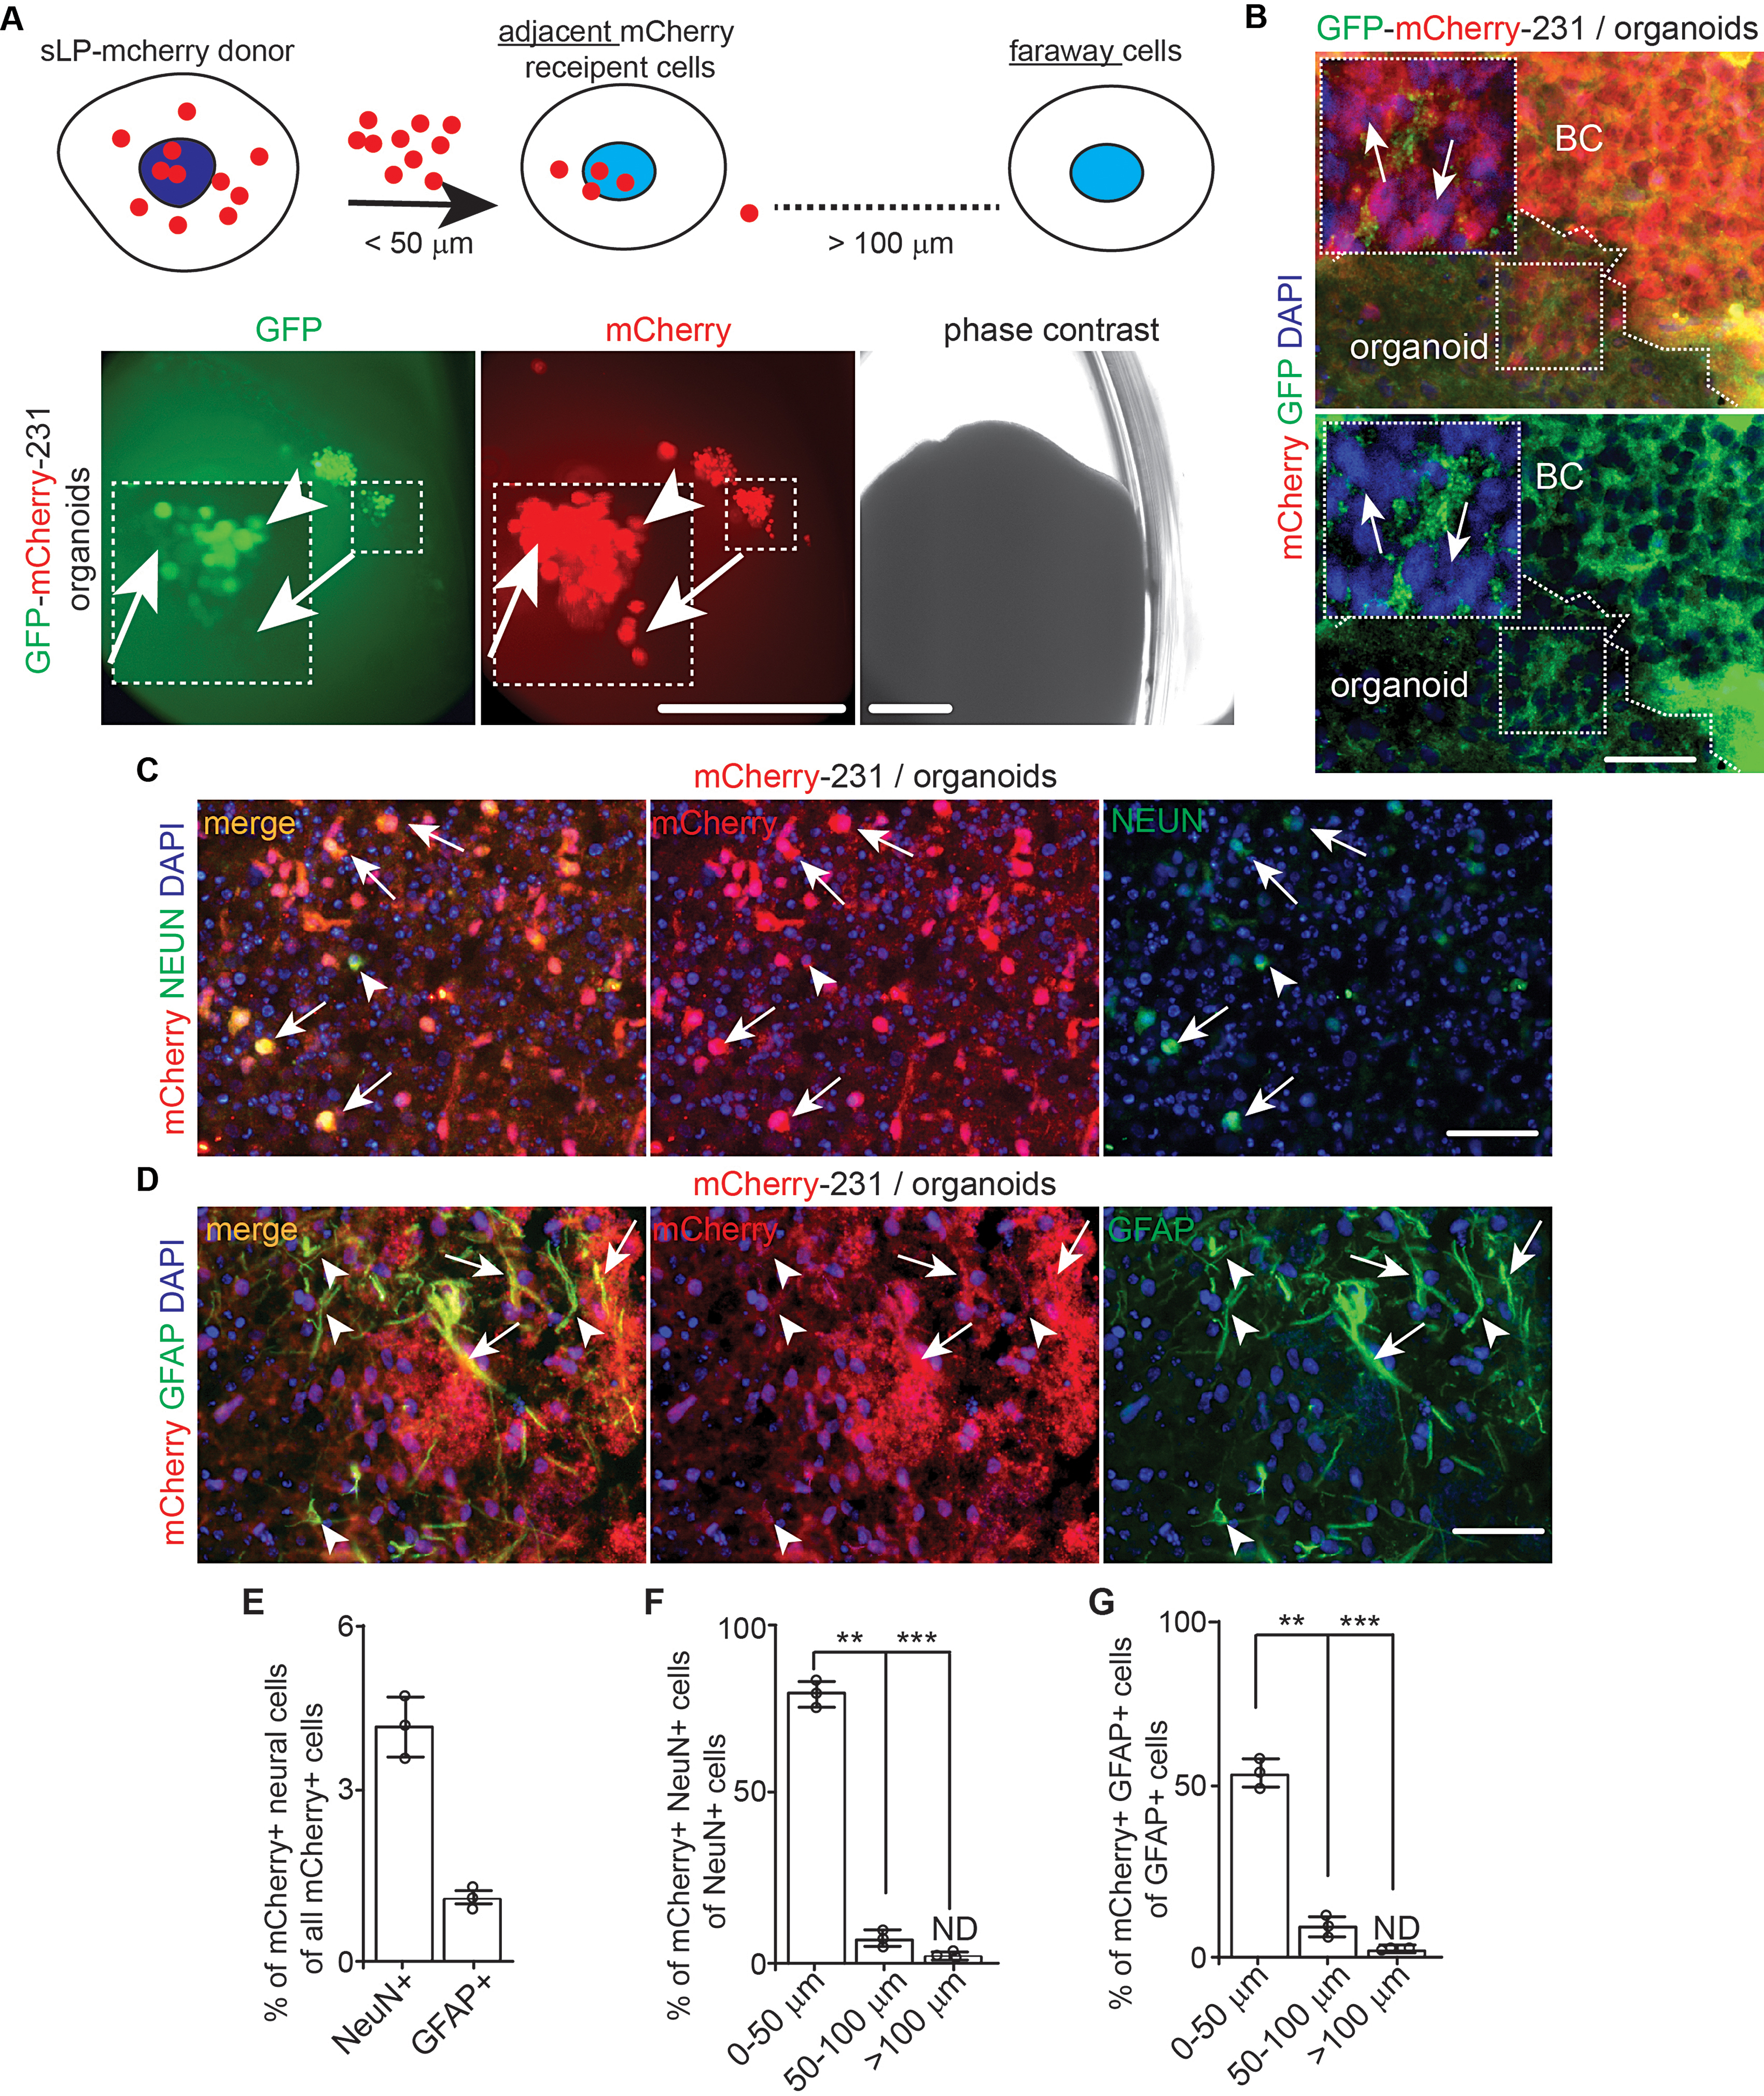
The transfer of sLP–mCherry from MDA-MB-231 breast cancer cells to neurons and astrocytes in cerebral organoids. (A) A schematic description for sLP-mCherry system to label neighbor recipient cells. Phase contrast and fluorescent images of GFP and mCherry of MDA-MB-231 cells in naïve WIBR3 organoids for 7 days. Arrows indicated mCherry+ organoid cells. Arrowhead indicated mCherry+ GFP+ breast cancer cells. Boxed area shown in detail as inset. (B) Fluorescence of GFP, mCherry, and DAPI of MDA-MB-231 cells in WIBR3 derived cerebral organoids. Arrows indicated mCherry+ cells in organoids. The dotted line indicated the boundary of breast cancer cells and organoids. Boxes shown in detail as inset. (C) IF of NEUN, mCherry, and DAPI of cerebral organoid cells and MDA-MB-231 cells expressing sLP–mCherry. Arrows indicated mCherry+ neurons while arrowheads indicated mCherry− neurons. (D) IF of GFAP, mCherry, and DAPI of cerebral organoid cells and MDA-MB-231 cells expressing sLP–mCherry. Arrows indicated mCherry+ astrocytes while arrowheads indicated mCherry− astrocytes. (E) Mean ± SE of percentage of NEUN+ mCherry+ cells and GFAP+ mCherry+ cells of total mCherry+ cells in the organoids. (F and G) Mean ± SE of percentage of NEUN+ mCherry+ cells of total NeuN+ cells (F) and GFAP+ mCherry+ cells of total GFAP+ cells (G) within different radius to tumor colony in organoid. Representative images and quantification were from 10 cerebral organoids in 3 independent experiments. One-way ANOVA and Student’s t-test were used for statistical analysis. ND: not determined, **: p < 0.01, ***: p < 0.001. Bar = 200 μm for A, 50 μm for B, C, and D
