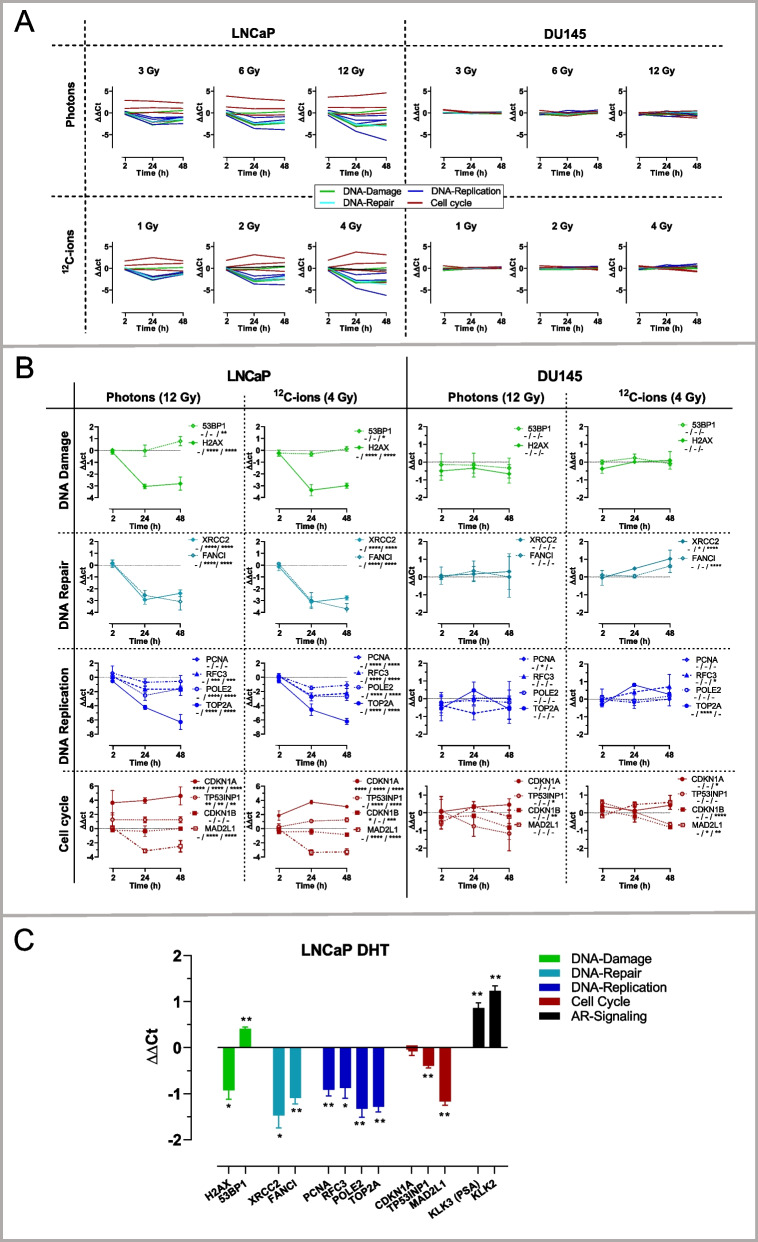
Fig. 3.
RT-qPCR analysis of selected mRNAs related to DNA-damage (green), DNA-repair (cyan), DNA replication (blue) and cell cycle (red) in LNCaP (left) and DU145 cells (right). A Overview of the changes of mRNA levels (ΔΔCt, mean, n = 3) upon photon and 12C-ion irradiations with all tested doses and time points. B Subsets of changes of mRNA levels (ΔΔCt) (mean ± SD, n = 3) in adjusted scales displayed for the irradiation modes with the maximum applied dose for photons (12 Gy) and for 12C-ions (4 Gy). Significant differences (2-way-ANOVA with multiple comparisons) are indicated for each time point (separated by slash) in the insets. C Changes of mRNA levels (ΔΔCt) after DHT treatment (20 nM; 24 h) of LNCaP cells for analysis of mRNAs related to DNA-damage (green), DNA-repair (cyan), DNA replication (blue), cell cycle (red) in addition to androgen receptor (AR) signaling (black). The changes of mRNA levels (ΔΔCt) are displayed (mean ± SD, n = 3). Significant differences between DHT and control were determined by unpaired Welch corrected t-test. Symbols of significances (*p < 0.05, **p < 0.01; ***p < 0.001; ****p < 0.0001)

