FIG. 1.
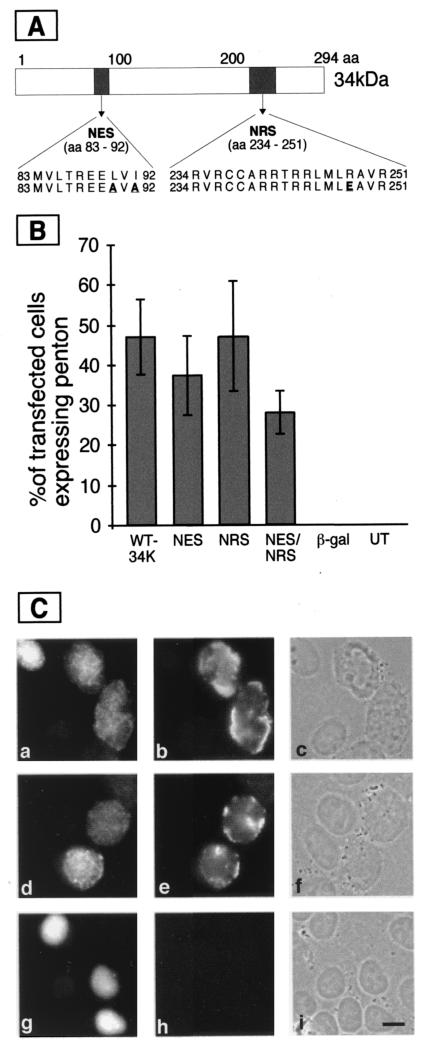
Complementation of gene expression in E4 deletion mutant infection by different mutant constructs of 34K. (A) Map of the 34K protein. 34K is depicted as a rectangle with the positions of the amino acids of the protein shown above. NES and NRS regions are shaded, and the regions are expanded below to show the amino acid sequence. Mutant and wild-type expression constructs were a kind gift of Matthias Dobbelstein and are described in reference 6. The mutations present in the NES and NRS are in bold and underlined. The NES mutation has a leucine and an isoleucine at positions 90 and 92 changed to alanines. The NRS mutation has an arginine at position 248 changed to glutamic acid. (B) HeLa cells were transfected and infected with an E4 deletion mutant as described in the text. Fixed cells were stained with M45 to detect 34K, and they were also stained with a polyclonal serum to detect the viral penton base and fiber proteins. Transfected cells were identified by the presence of 34K and were then scored for the presence or absence of late proteins. The columns represent the percent of transfected cells that also contained late proteins. Abbreviations used for the different constructs: WT34K, wild-type 34K; NES, double point mutation L90A/I92A in the nuclear export signal; NRS, point mutation R248E in the nuclear retention signal; NES/NRS, L90A/I92-R248E double mutation in the nuclear export and retention signals; β-gal, construct expressing β-galactosidase; UT, infected cells that were not transfected. (C) Cells transfected with constructs expressing wild-type 34K (panels a through c), NES-mutated 34K (panels d through f), or green fluorescent protein (panels g through i). Following infection with H5dl 1011, cells were fixed and stained as described in Fig. 1B. Cells stained for the transfected protein are shown in panels a, d, and g; late viral proteins are shown in panels b, e, and h. The total number of cells in the microscope fields are visualized in panels c, f, and i. Bar, 10 μm.

