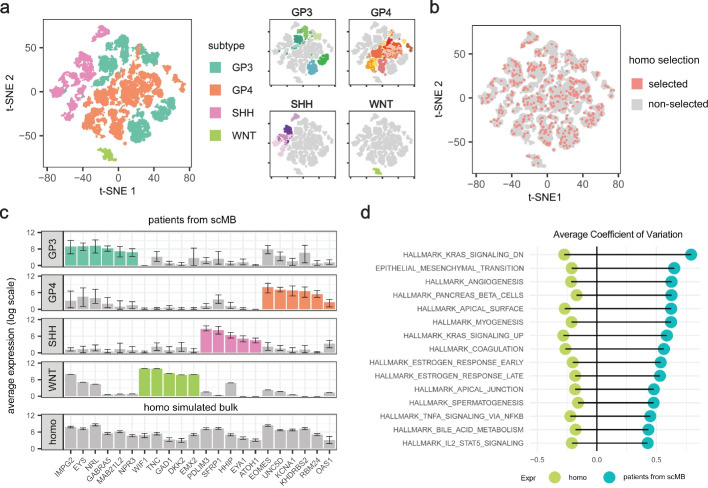
Fig. 2.
Bulk simulation using random cells failed to retain intra-tumor variations. a tSNE plot of n = 31,823 malignant cells from 28 medulloblastoma patients in Riemondy2022_MB dataset, colored by MB subtypes (left) and patient ID (right). b tSNE plot showing that 500 randomly selected malignant cells are evenly dispersed among 31,823 malignant cells. c Barplot showing the average expression levels of 22 MB subtype-specific genes in different groups of samples, colored by different MB subtypes. Upper panel: average expression levels of these genes across different MB subtype patients from Riemondy2022_MB; bottom panel: average expression values in 100 homogeneous simulated bulk samples, with error bars indicating the 10th and 90th quantiles. d Diverging bar plot comparing variance of hallmark gene-sets between homo-simulated and patient-specific bulk expression from Riemondy2022_MB, with patient-specific expression defined as the aggregated expression of single cells from the same patient

