
Figure 4.
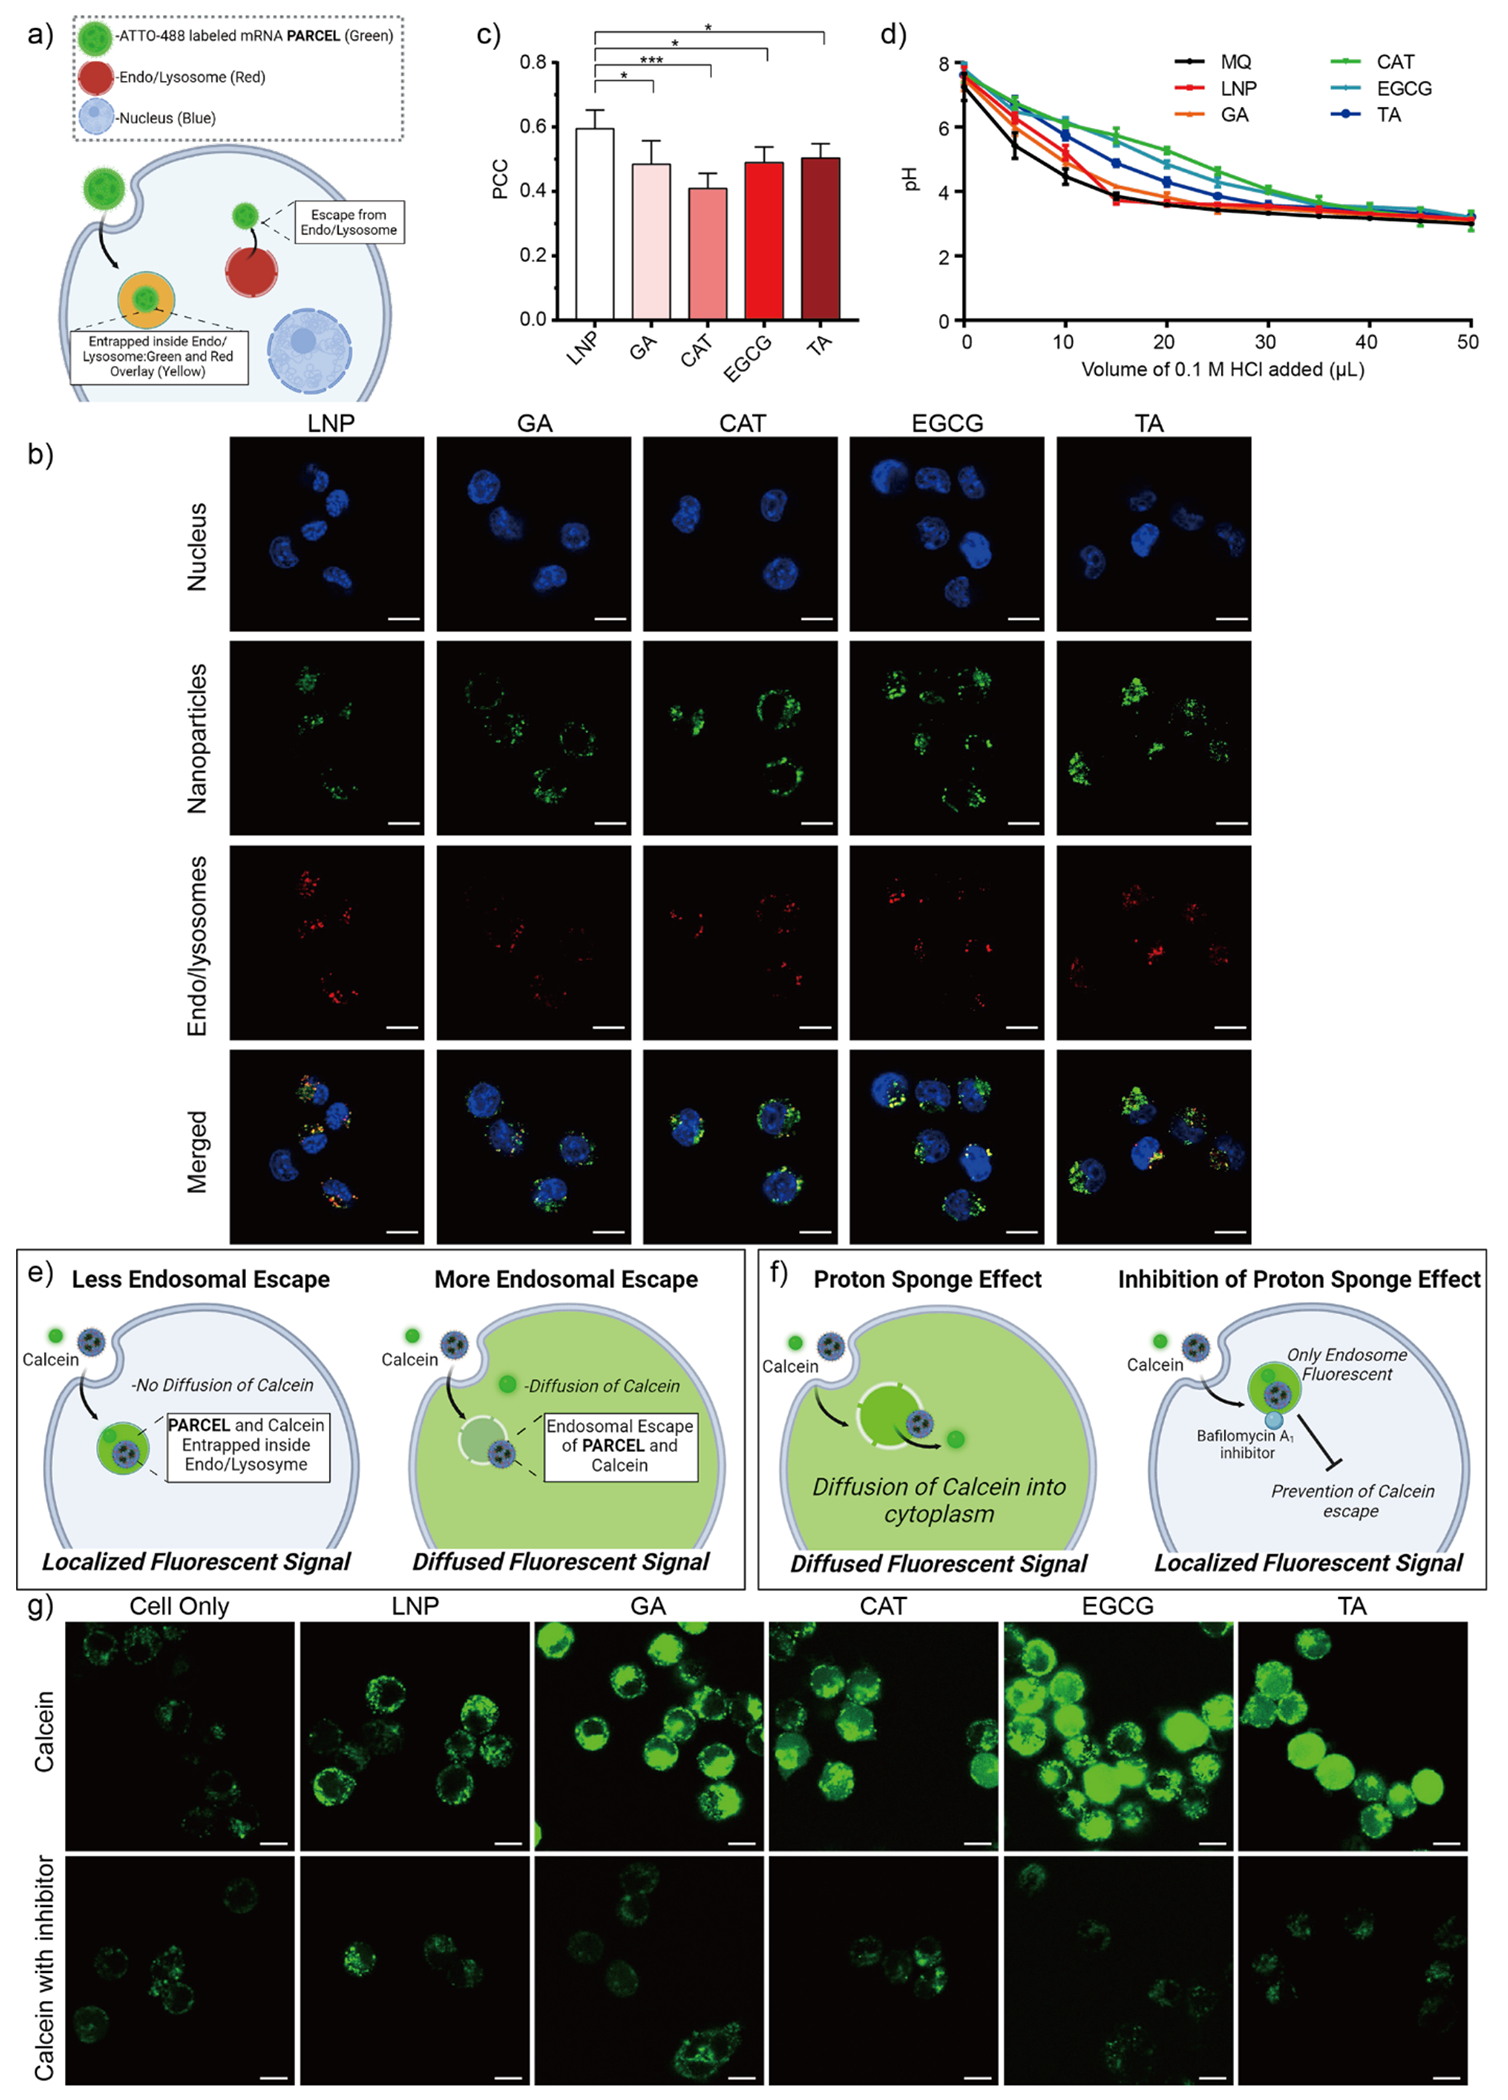
(a) Schematic illustration of our endosomal escape studies using a lysotracker confocal imaging assay. (b) Representative confocal images of DC 2.4 cells treated with ATTO-488 labeled PARCEL (green). Endo/lysosomes (red) were stained with LysoTracker Deep Red. Nuclei (blue) were stained with Hoechst 33342. Scale bars are 10 μm. (c) Pearson Correlation Coefficient (PCC) analysis of ATTO-488 labeled PARCEL (Data presented as the mean ± SD, ***p < 0.001 and *p < 0.05 with 95% of confidence level from unpaired t-test, Figure S6). (d) Titration curves of PARCEL in suspensions as a function of HCl. Schematic illustration of our endosomal escape studies using (e) a calcein assay and (f) a proton sponge effect assay using bafilomycin A1 for the termination of the inflow of H+ and Cl−. (g) Representative confocal images of DC 2.4 cells incubated with calcein and PARCEL in the absence (top row) and presence (bottom row) of inhibitor bafilomycin A1 for 4 h at 37 °C. PARCELs were not fluorescently labeled to avoid interference with the calcein signal. Scale bars are 10 μm. (All data presented as mean ± SD, n = 3).