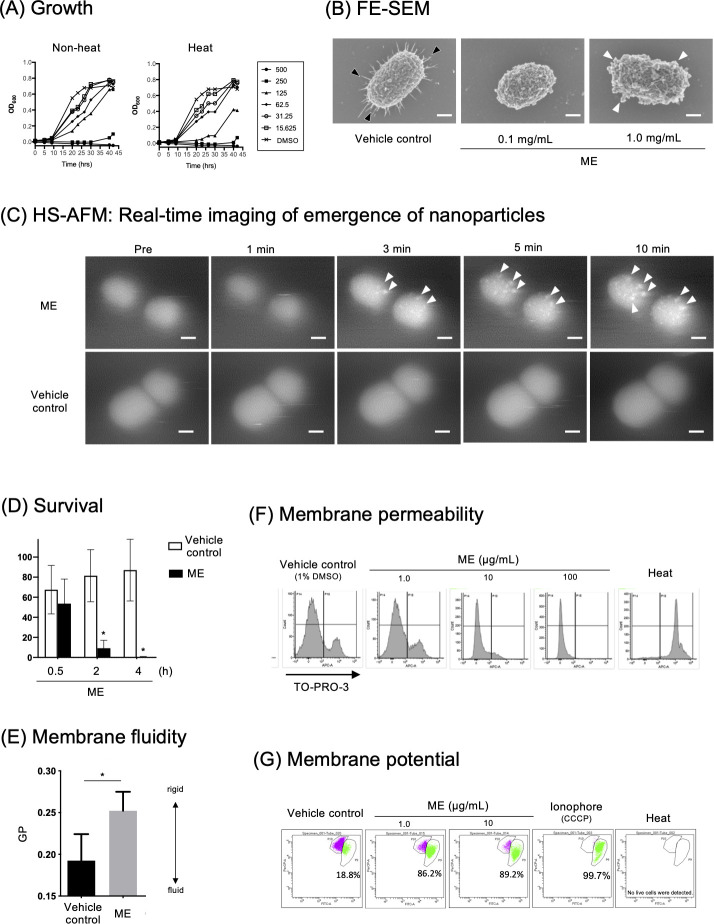
Fig 1.
ME inhibits P. gingivalis growth by triggering both morphological and physiological changes at the cell envelope. (A) Growth inhibition. P. gingivalis was anaerobically grown for 2 days in the absence or presence of ME (left) or heated ME (right) at different concentrations (from 15.625 to 500 µg/mL). In the vehicle control, 1% DMSO was added instead of the samples. The turbidity (OD600) of the culture broth was measured at different time points. (B) FE-SEM. P. gingivalis was treated with ME at concentrations of 100 µg/mL or 1 mg/mL and vehicle control (1% DMSO) for 30 min at 18°C to 25°C. Morphology of P. gingivalis cells was observed by FE-SEM. Fimbriae and nano-particle formation are denoted by black and white arrowheads, respectively. Bars: 150 nm. (C) HS-AFM. Spatiotemporal analysis of P. gingivalis cell envelope after treatment with ME (1 µg/µL) or vehicle control (1% DMSO). Nano-particles are denoted by white arrowheads. Bars: 200 nm. See also Video S1. (D) Time-course killing activity. P. gingivalis cells were treated with vehicle control (Control) and ME at 100 µg/mL for 0.5, 2, and 4 h. Survival rates were evaluated by counting CFUs on BAPs and was denoted as [CFU (tested sample)/CFU (baseline, untreated sample)] × 100 (%). *P < 0.05. (E) Membrane fluidity. Fluidity of P. gingivalis cell membrane was estimated by a fluorescence probe, laurdan, that intercalates into the membrane bilayer and displays an emission wavelength shift depending on the amount of water molecules in the membrane. P. gingivalis cells were treated with ME at a concentration of 100 µg/mL. The membrane fluidity of P. gingivalis was calculated as generalized polarization of laurdan (GP) according to the formula: GP = (A455 − A495)/(A455 + A495). (F) Membrane permeability. The membrane permeability of P. gingivalis was estimated by the membrane impermeable dye TO-PRO-3 using flow cytometry. The TO-PRO-3-positive P. gingivalis cell population inversely correlated to the concentrations of ME. P. gingivalis cells were also subjected to heat treatment (Heat) as a control of cells with increased membrane permeability. (G) Membrane potential. A membrane potential-sensitive dye DiOC2(3) was used for Gram-negative bacterial membrane potential assay using E. coli as a model. The intensity of the ionophoric activity was estimated by the increased green-colored and decreased purple-colored populations, indicating depolarized and polarized cell populations, respectively, as shown in each dot plot panel. The percentages shown are calculated as a ratio of the number of depolarized cells to the number of total cells that retained membrane integrity. No data of membrane potential were obtained in heated cells, as heat treatment resulted in loss of the membrane integrity of all the cells. ME was used at a concentration of 1 or 10 µg/mL. carbonyl cyanide 3-chlorophenylhydrazone (CCCP), a strong ionophore, was also used as a positive control triggering membrane depolarization. Cells were also subjected to heat treatment (Heat) as a control of cells with increased membrane permeability.

