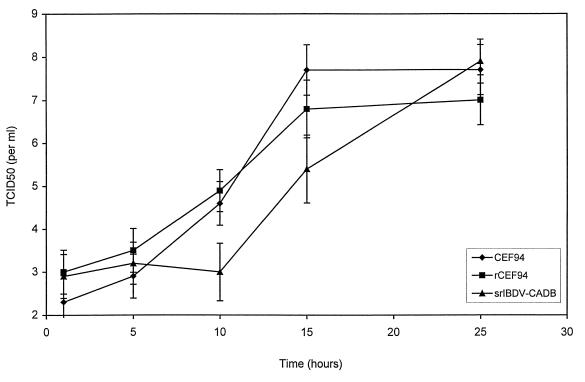
FIG. 5.
Single-step growth curves of CEF94, rCEF94, and srIBDV-CADB. QM5 cells were infected with IBDV (MOI = 5) for 1 h beginning at time zero, washed three times, and covered with fresh medium. At different time points samples were taken from the supernatant and the amount of IBDV (TCID50 per milliliter) was determined. The TCID50 at each time point is the mean of three independent experiments; error bars represent standard deviations.

