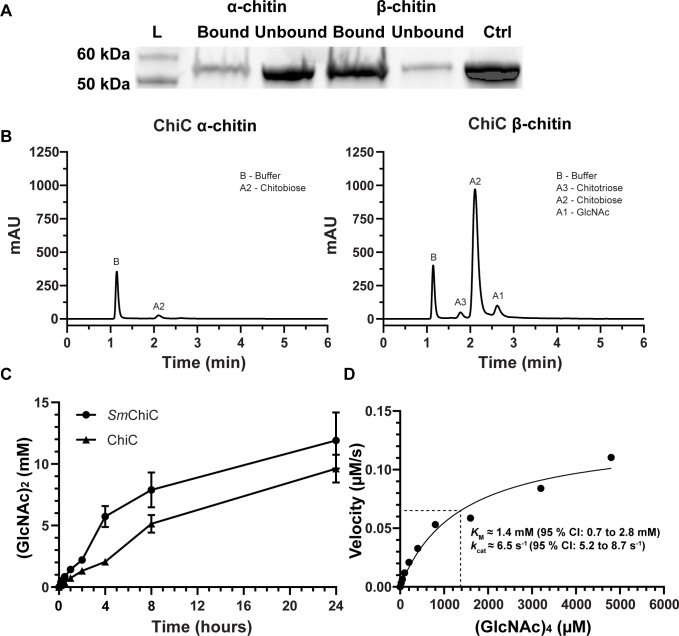
Fig 2.
ChiC binding and activity against chitin and chitooligosaccharides. (A) SDS-PAGE analysis showing the bound and unbound fractions of ChiC to α- and β-chitin, including a control with only ChiC. (B) Chromatograms showing product formation after incubation of ChiC with α-chitin (left) and β-chitin (right) for 2 h at 37°C, pH 7.5. (C) The chitinase activity of SmChiC and ChiC was measured over a 24-h period at 37°C, pH 7.5. The data are plotted as the mean ± standard deviation (SD), representing experiments performed in triplicate. (D) Michaelis–Menten kinetic analysis of ChiC incubated with varying concentrations of (GlcNAc)4 at 37°C. The velocity was determined by quantifying the cleavage of (GlcNAc)4 into (GlcNAc)2 over time using 20 nM ChiC. KM ([S] at 1/2 Vmax) is indicated by the dashed lines. The curve is fitted using the Michaelis–Menten model with non-linear regression in GraphPad Prism version 10.0.2 and shown as the best fit with a 95% confidence interval (CI).

