Fig 4.
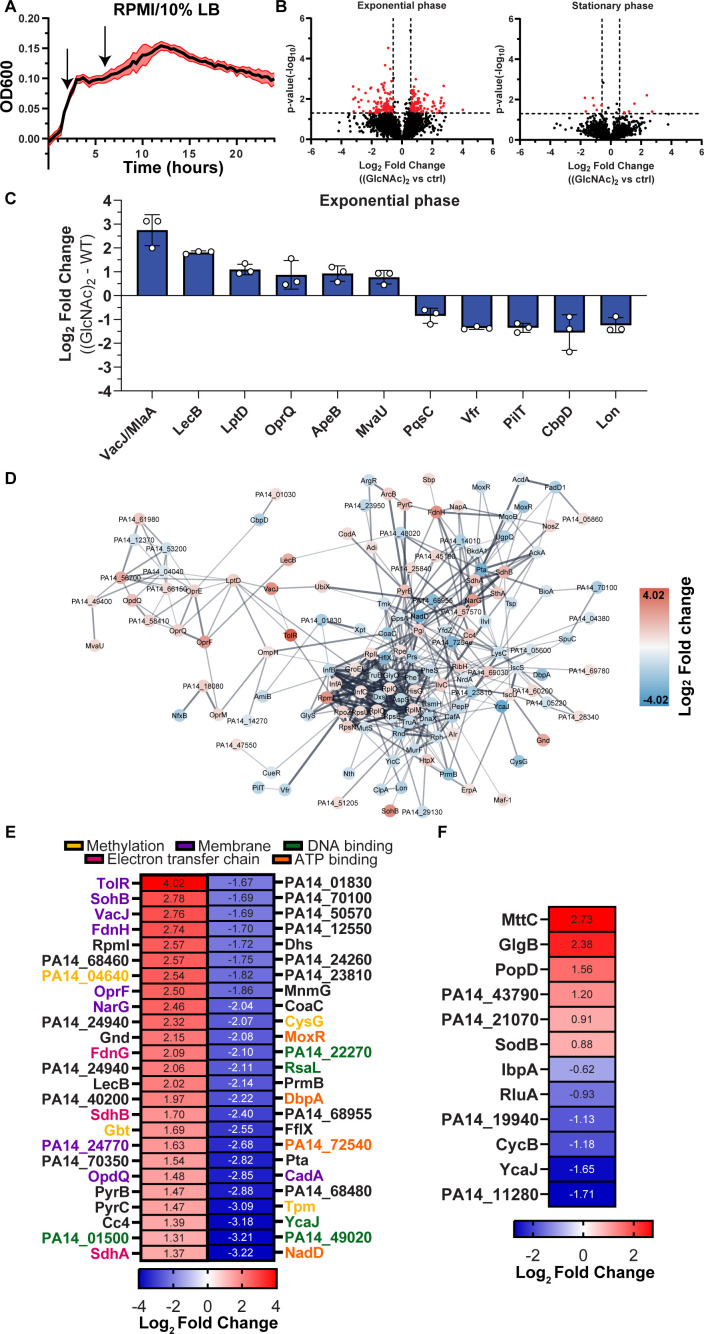
Proteomic analysis of PA (WT) (UCBPP-PA14) spiked with (GlcNAc)2. (A) Growth curve of PA WT (UCBPP-PA14) in RPMI 1640 supplemented with 10% LB. The administration of (GlcNAc)2 is indicated by arrows. (B) Volcano plots displaying the log2 fold change of each detected protein and their corresponding P-values (−log10) within the proteomics data set. The plots compare the (GlcNAc)2 against the control (ctrl) treatment (addition of water) when supplemented at exponential and stationary growth phases. Significance was determined by a paired two-tailed t-test, and the cutoff was defined as P = 0.05 (−log10 = 1.3) and (±)1.5-fold change (log2 = 0.58). (C) Histogram displaying the log2 fold change of significant up- and downregulated proteins associated with infection and virulence. The data are plotted as the mean ± SD. (D) STRING network analysis illustrating the interconnections of the significantly upregulated (red) and downregulated (blue) proteins when (GlcNAc)2 was administered at exponential phase of PA growth. The average fold change (log2) is depicted within the nodes. Proteins without any connections to the network are omitted from the visualization (singletons). The default confidence cutoff of 0.4 was used for the network analysis. (E, F) A heatmap showing the top 25 up- and downregulated proteins in the samples comparing the (GlcNAc)2 against control (ctrl) when supplemented at the exponential and stationary growth phases (marked with black square). The average log2 fold change is depicted. The proteins denoted by the various colors are associated with distinct GO terms.

