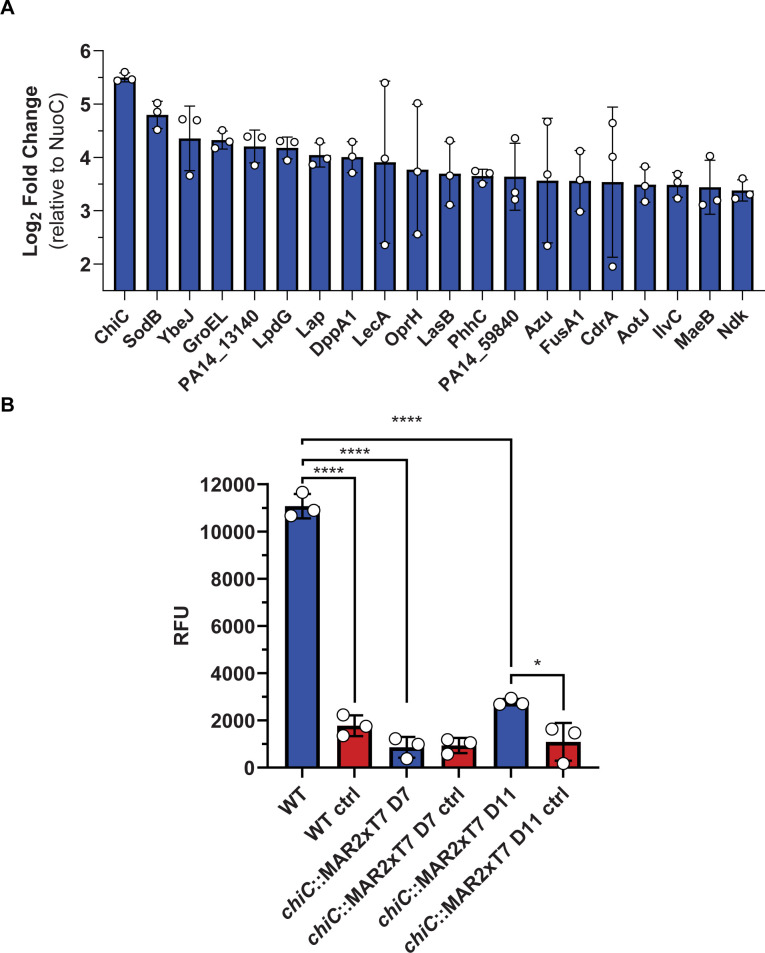
Fig 5.
The proteome and chinolytic activity of the Pel biofilm. (A) A histogram displaying the top 20 abundant proteins in the Pel biofilm presented as the mean log2 fold change ± SD relative to the housekeeping protein NADH-quinone oxidoreductase subunit C/D (NuoC). (B) Activity of the Pel biofilm against the substrate analog 4MU-(GlcNAc)2, incubated for 2 h at 37°C. Water was added in the control samples replacing 4MU-(GlcNAc)2. The measured relative fluorescence unit (RFU) is displayed as the mean ± SD, representing three biological replicates and two technical replicates. Data are analyzed by one-way ANOVA (Tukey’s multiple comparisons).

