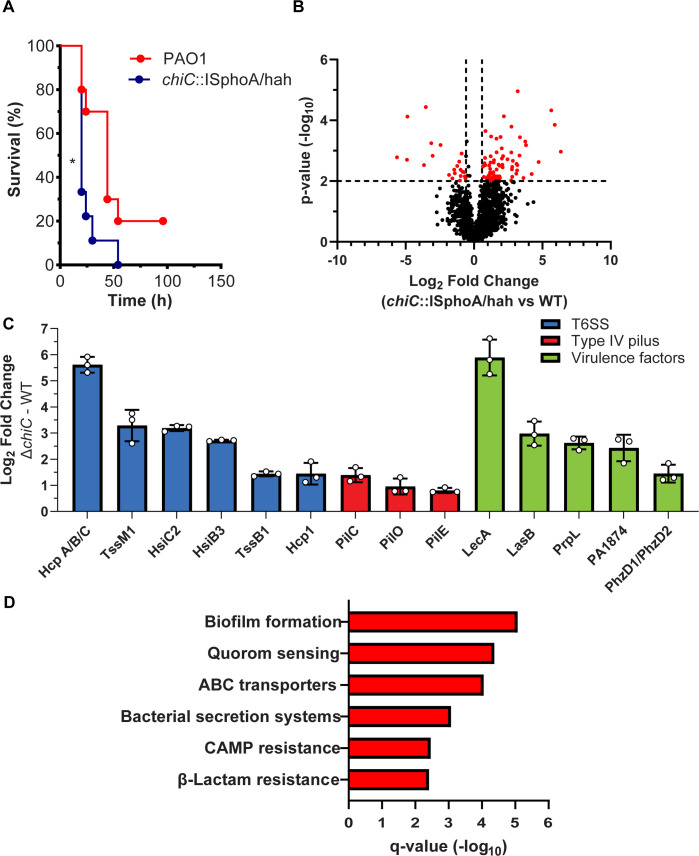
Fig 7.
Contribution of ChiC to virulence of PA. (A) Kaplan–Meier survival (%) curves of CD-1 mice inoculated with PAO1 and the chiC::ISphoA/hah transposon insertion mutant. The significance is indicated by an asterisk (*) (P < 0.05). P = 0.022 by the Mantel–Cox test. (B) Volcano plot showing the log2 fold change of all detected proteins and their corresponding P-values (−log10) in chiC transposon mutant against the WT parent strain. Significance was determined by a paired two-tailed t-test, and the cutoff was defined as P = 0.01 (−log10 = 2.0) and (±)1.5-fold change (log2 = 0.58). (C) A histogram displaying selected significantly upregulated proteins associated with infection and virulence in the chiC transposon mutant against the WT strain. The average fold change (log2) is depicted ±SD. (D) KEGG pathway enrichment analysis of the upregulated proteins comparing the chiC transposon mutant against the WT (red bars) with corresponding q-values (−log10). Proteins with q-values of ≤0.05 were defined to be significant.

