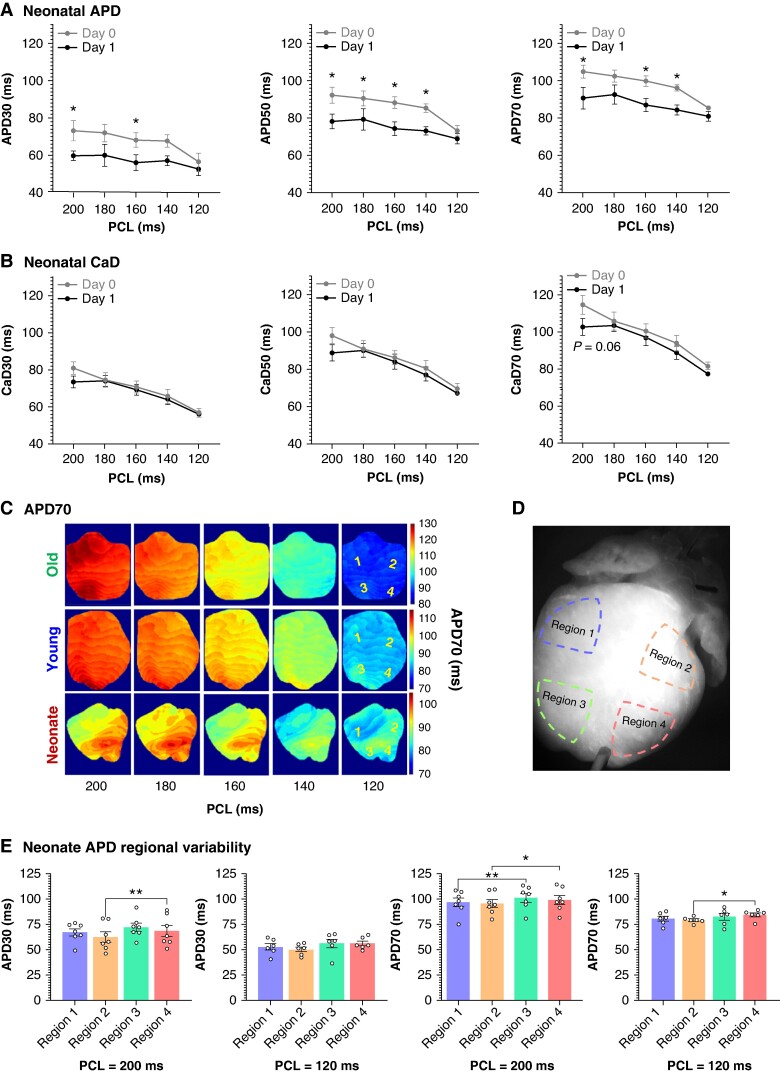
Figure 5.
Intragroup and regional variability in neonatal guinea pig hearts (dynamic stimulation). A) Action potential duration and B) CaD restitution curves generated from neonatal hearts isolated on postnatal Day 0 (n = 4–5) and postnatal Day 1 (n = 4). Dynamic pacing (S1–S1) was applied to the apex; the PCL was decremented from 200 to 120 ms. Values reported as mean ± SEM. Comparison by two-way ANOVA with multiple comparisons, *P < 0.05. C) Illustrative APD70 maps of a neonate, younger adult, and older adult heart in response to dynamic S1–S1 apical pacing. Note the regional variability in the neonatal heart. D) Schematic of four epicardial ventricular regions of interest. E) APD30 and APD70 measurements from neonatal hearts, were collected in response to a slow pacing rate (200 ms PCL, n = 7) and faster pacing rate (120 ms PCL, n = 6). Values reported as mean ± SEM. Comparison by one-way (matched) ANOVA with multiple comparisons; *P < 0.05, **P < 0.01 between different regions. APD, action potential duration; CaD, calcium transient duration; PCL, pacing cycle length.

