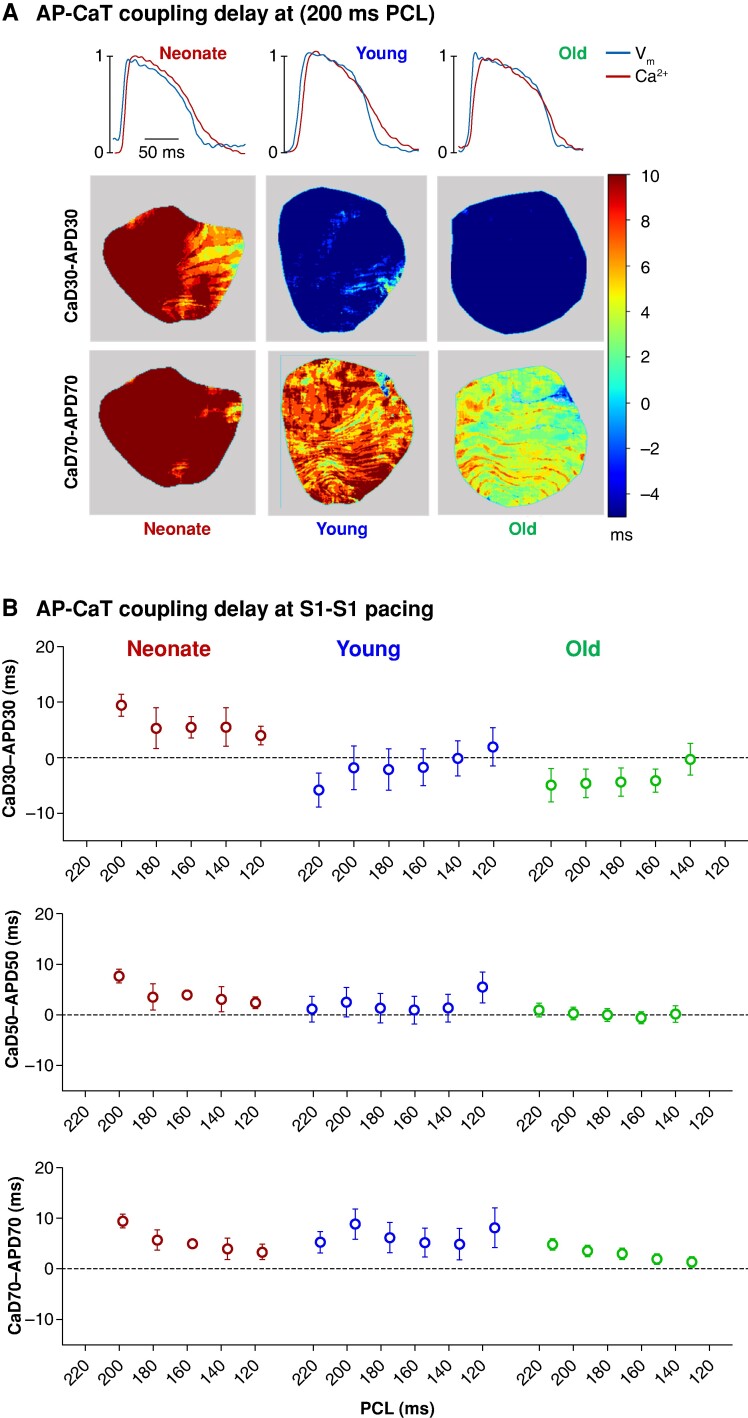
Figure 8.
Action potential and CaT coupling characteristics across guinea pig age groups. A) Top: Representative traces of AP and CaT were recorded simultaneously from a neonate, younger adult, and older adult heart. Bottom: Representative AP–CaT latency maps (CaD–APD) measured at 30 and 70% duration. B) Quantitative comparison of AP–CaT latency at 30, 50, and 70% duration in neonatal (n = 4), younger adult (n = 6), and older adult (n = 8) guinea pigs. Positive values indicate that the CaD is longer, while negative values indicate that the APD is longer for a given measurement. All measurements were recorded in response to dynamic (S1–S1) ventricular epicardial pacing at the apex. Values reported as mean ± SEM. AP, action potential; APD, action potential duration; CaD, calcium transient duration; CaT, calcium transient.

