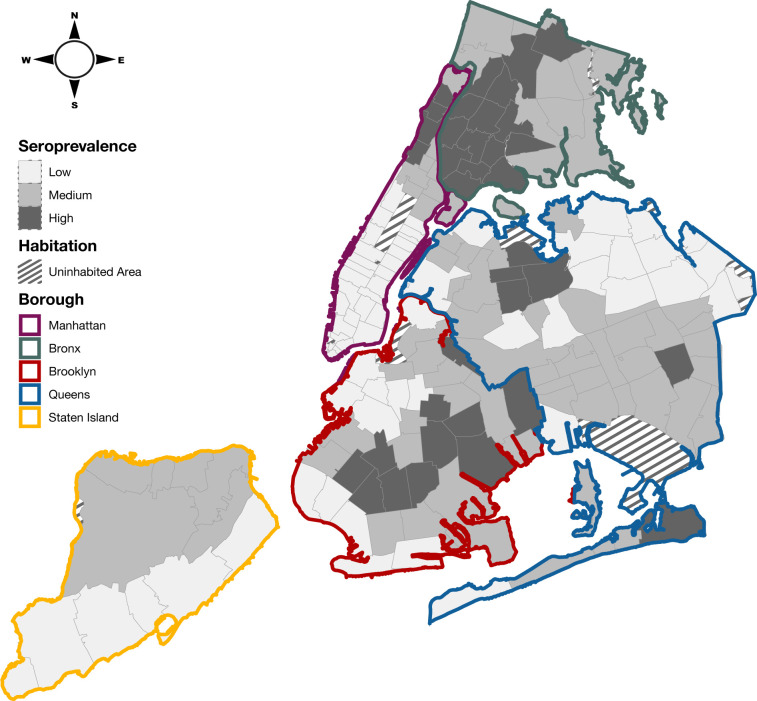
Fig 1. Seroprevalence of SARS-CoV-2 antibodies across NYC in November 2020.
Color borders indicate boroughs. Gray borders denote ZIP codes and shading indicates seroprevalence. The base layer of the map obtained from: https://data.cityofnewyork.us/Health/Modified-Zip-Code-Tabulation-Areas-MODZCTA-Map/5fzm-kpwv, distributed openly under the following terms and conditions: https://www.nyc.gov/home/terms-of-use.page.

