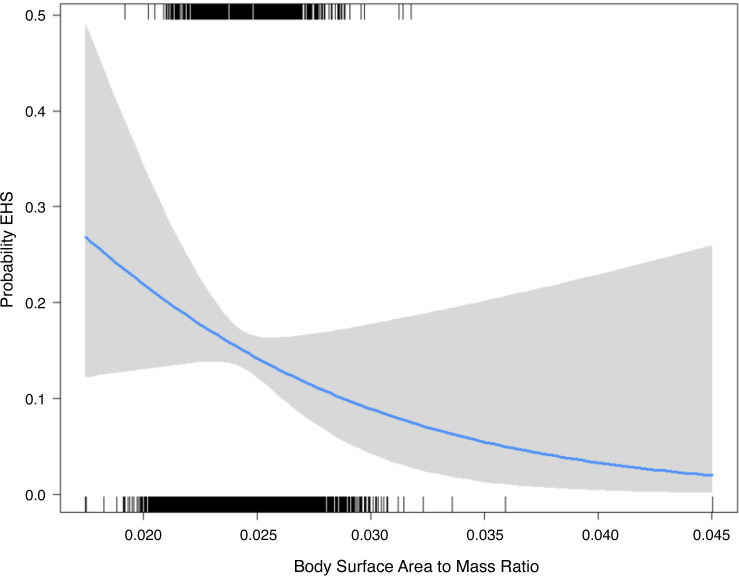
Figure 1.
The probability of having an EHS by BSA·mass−1. The gray area represents the 95% confidence intervals for the probability (blue line) at each BSA·mass−1 amount. The rug plot at the top of the figure represents the BSA·mass−1 distribution for the cases, and the rug plot at the bottom of the figure represents the BSA·mass−1 distribution for the controls. BSA, body surface area; EHS, exertional heat stroke.

